2.1 Tally Charts And Frequency Tables Worksheet Page 15
ADVERTISEMENT
 1
1 2
2 3
3 4
4 5
5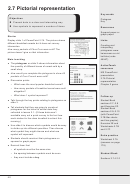 6
6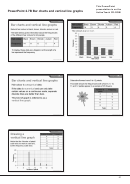 7
7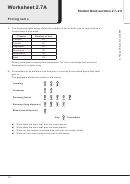 8
8 9
9 10
10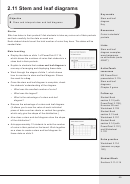 11
11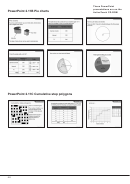 12
12 13
13 14
14 15
15 16
16 17
17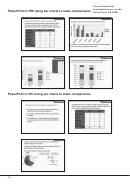 18
18 19
19 20
20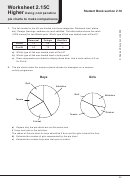 21
21 22
22 23
23 24
24 25
25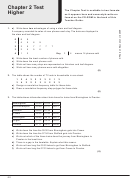 26
26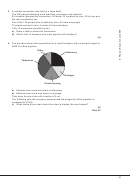 27
27Worksheet 2.11C
Student Book section 2.13
Advantages and
disadvantages of diagrams
1.
Write down two advantages of using a bar chart to display data.
2.
Write down two advantages of using a stem and leaf diagram to display data.
3.
Write down one disadvantage of using a pie chart to display data.
4.
James collects some data. He records the number of siblings each member of
his class has. He decides to use a pie chart to display the data. This is not the
best choice.
Write down the name of a better diagram to use and give a reason for your choice.
5.
A company is producing different diagrams to display data for different clients.
bar chart
vertical line graph
pictogram
pie chart
stem and
leaf diagram
For each set of data below choose which diagram listed above would be the best
choice to display the data. Give a reason for your answer.
a)
The amount of rain that fell daily during August in a holiday resort.
b)
Which animals could be seen in a zoo.
c)
The marks scored by individual competitors in a gymnastics competition.
d)
The different types of rubbish which are recycled by a local authority.
e)
The cost of staying in hotels in different cities.
f)
The different kinds of fish caught in a trawler’s nets.
g)
The daily hours of sunshine in a town.
h)
The approximate attendance at 5 football matches.
i)
The proportion of different crops grown on a farm.
49
ADVERTISEMENT
0 votes
Related Articles
Related forms


 - 1ma0 Frequency Tables Worksheet - Edexcel Gcse")


Related Categories
Parent category: Education