2.1 Tally Charts And Frequency Tables Worksheet Page 24
ADVERTISEMENT
 1
1 2
2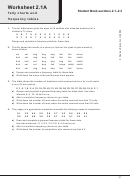 3
3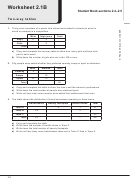 4
4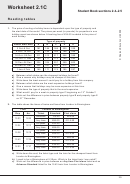 5
5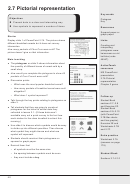 6
6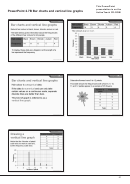 7
7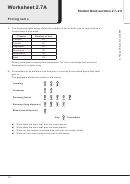 8
8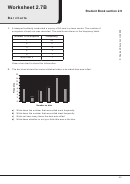 9
9 10
10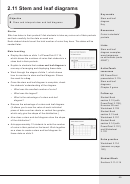 11
11 12
12 13
13 14
14 15
15 16
16 17
17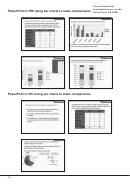 18
18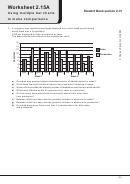 19
19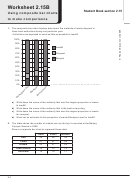 20
20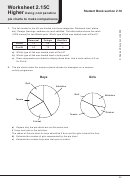 21
21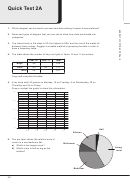 22
22 23
23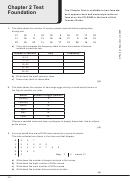 24
24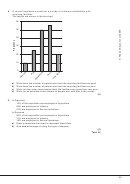 25
25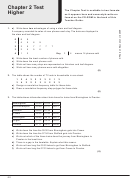 26
26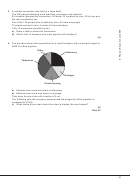 27
27Chapter 2 Test
The Chapter Test is available in two formats:
Foundation
as it appears here and exam-style write-on
format on the CD-ROM in the back of this
Teacher Guide.
1.
The table shows the number of lessons people required before passing their
driving test.
17
18
7
19
10
9
10
17
17
18
11
19
11
13
18
19
17
9
29
12
23
10
27
11
19
17
12
20
15
14
a)
Copy and complete the frequency table to show the number of lessons
required to pass the test.
Number of lessons
Tally
Frequency
6–10
11–15
16–20
21–25
26–30
b)
Write down the most common class.
c)
Draw a bar chart for these data.
(8)
2.
The table shows the number of free range eggs sold by a small poultry farmer in
the first six months of a year.
Month
Number of eggs (dozens)
January
8
February
6
March
16
April
12
May
18
June
20
Choose a sensible scale and draw a pictogram to display these data. Use an ellipse
as the picture.
(4)
3.
A survey asked how many DVDs were owned by a group of people.
The data collected are shown in the stem and leaf diagram.
0
2
4
7
1
3
4
8
8
9
2
2
2
2
6
7
8
9
3
3
4
5
4
2
Key
1
3
means 13
a)
Write down the number of people involved in the survey.
b)
Write down the least number of DVDs owned.
c)
Write down the most number of DVDs owned.
d)
Write down the number that occurred most often.
(4)
58
ADVERTISEMENT
0 votes
Related Articles
Related forms


 - 1ma0 Frequency Tables Worksheet - Edexcel Gcse")


Related Categories
Parent category: Education