2.1 Tally Charts And Frequency Tables Worksheet Page 8
ADVERTISEMENT
 1
1 2
2 3
3 4
4 5
5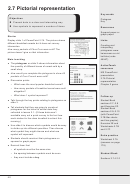 6
6 7
7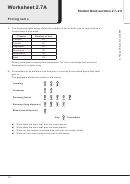 8
8 9
9 10
10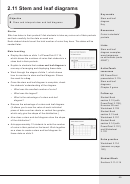 11
11 12
12 13
13 14
14 15
15 16
16 17
17 18
18 19
19 20
20 21
21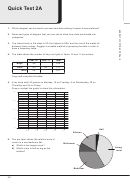 22
22 23
23 24
24 25
25 26
26 27
27Worksheet 2.7A
Student Book sections 2.7–2.8
Pictograms
1.
The frequency table below shows the number of tins of each type of soup sold by a
corner shop in one week.
Flavour
Number of tins
Chicken
65
Tomato
50
Vegetable
45
Mushroom
20
Minestrone
30
Beef
35
Draw a pictogram to display this information. Tip: Use a rectangle for the picture.
Remember to include a key.
2.
All members of an athletics club took part in a survey to find which sports they take
part in.
The pictogram shows the results of the survey.
Jumping
Throwing
Running (track)
Running (long distance)
Mixed (decathlon etc.)
Key
5 members
a)
Write down the sport that was the most popular.
b)
Write down the sport that was the least popular.
c)
Work out the number of people who took part in running (track).
d)
Work out how many people took part in the survey.
42
ADVERTISEMENT
0 votes
Related Articles
Related forms


 - 1ma0 Frequency Tables Worksheet - Edexcel Gcse")


Related Categories
Parent category: Education