2.1 Tally Charts And Frequency Tables Worksheet Page 19
ADVERTISEMENT
 1
1 2
2 3
3 4
4 5
5 6
6 7
7 8
8 9
9 10
10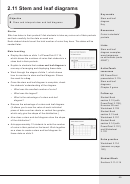 11
11 12
12 13
13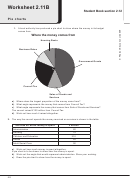 14
14 15
15 16
16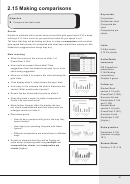 17
17 18
18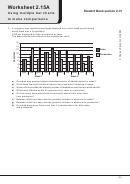 19
19 20
20 21
21 22
22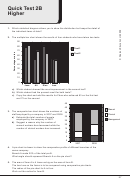 23
23 24
24 25
25 26
26 27
27Worksheet 2.15A
Student Book section 2.15
Using multiple bar charts
to make comparisons
1.
A company kept records of employee absence over a two-week period during
which there was a flu epidemic.
Staff are employed in either production or sales.
The data collected are shown in the multiple bar chart.
16
14
Sales
12
10
Production
8
6
4
2
0
Mon
Tue
Wed
Thu
Fri
Mon
Tue
Wed
Thu
Fri
Week 1
Week 2
a)
On which day was the highest recorded number of people absent in sales?
b)
Write down the total number of person days lost due to absence in sales.
c)
Which office recorded the highest number of absentees over the two-week period?
d)
Which was affected by the flu epidemic first, sales or production?
e)
On how many days were there more people absent from sales than
from production?
f)
Between which two days was the greatest increase in absence for sales?
g)
Between which two days was the greatest increase in absence for production?
h)
On which days were there more than 10 people absent for both sales
and production?
53
ADVERTISEMENT
0 votes
Related Articles
Related forms


 - 1ma0 Frequency Tables Worksheet - Edexcel Gcse")


Related Categories
Parent category: Education