Graphical Approach For Cvp Analysis (Break-Even Chart) Worksheet - Chapter 3 Page 2
ADVERTISEMENT
 Worksheet - Chapter 3 Printable pdf") 1
1 2
2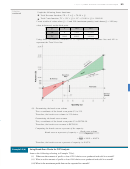 3
3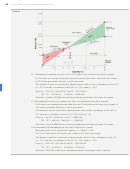 4
4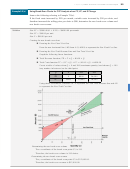 5
5 6
6 7
792
Chapter 3
| Break-Even and Cost-Volume-Profit Analysis
Creating and Understanding a Break-Even Chart
Step I:
Drawing and labelling the X-axis and Y-axis
■
Draw a horizontal axis (X-axis) to represent the quantity (x) produced and sold. Use a suitable scale
with equal incremental markings from 0 to the maximum quantity. Label the X-axis as "Quantity (x)".
■
Draw a vertical axis (Y-axis) to represent the Total Revenue (TR) or Total costs (TC). Use a suitable scale
and equal incremental markings from 0 to the maximum total revenue. Label the Y-axis as "Amount ($)".
■
Mark the Point "O" where the X-axis and Y-axis intersect each other. The point "O" is the origin with
co-ordinates (0, 0).
Step II:
Drawing the Fixed Costs Line
Determine the Fixed Costs (FC) and mark a point "A" to represent this amount on the Y-axis.
Through this point, draw a line "AB" parallel to X-axis. This is the "Fixed Costs line".
Step III:
Drawing the Total Revenue Line and Total Costs Line
■
The Total Revenue function, TR = P × Q, is a linear function represented by line OC.
■
The Total Costs function, TC = (VC × Q) + FC, is a linear function represented by line AD.
Create a table of values by choosing the two end points (Q = 0 and Q = maximum quantity) and
their corresponding TR and TC values to draw the two lines. To confirm the linearity of each line
include another value for Q between the two points (as a test point) in the table of values.
Step IV:
Determining the break-even point, break-even volume, break-even revenue, and the profit
and loss areas
■
The point "E", where the Total Revenue line (OC) and the Total Cost line (AD) intersect is the
break-even point, where there is neither profit nor loss.
■
The break-even volume is the x-coordinate of the break-even point E.
■
The break-even revenue is the y-coordinate of the break-even point E.
■
Any quantity produced and sold greater than the break-even volume will generate a profit. The
profit area is the section ECD, where the Total Revenue line (OC) is above the Total Costs line
(AD). The amount of profit for any quantity above the break even volume is represented by the
vertical distance between the two lines EC and ED.
■
Any quantity produced and sold less than the break-even volume will generate a loss. The loss
area is the section OAE, where the Total Revenue line (OC) is below the Total Cost line (AD).
The amount of loss for any quantity below the break even volume is represented by the vertical
distance between the two lines AE and OE.
Example 3.2 (a)
Creating a Break-Even Chart, Determining Break-Even Revenue and Break-Even Volume,
and Computing Break-Even as Percent of Capacity (Maximum Quantity)
Johnathan's company has a capacity to produce and sell 300 chairs per month. The fixed costs are
$5000 per month, variable costs are $30 per chair, and selling price is $70 per chair.
(i) Draw a detailed break-even chart showing the fixed costs line, total costs line, total revenue
line, break-even point, and profit and loss areas.
(ii) Determine the break-even volume and break-even revenue, and compute the break-even as a
percent of the capacity.
Solution
Step I:
Draw the X-axis and Y-axis as explained earlier.
Step II:
Drawing the Fixed Costs Line
Draw the horizontal line (AB) from A (0, 5000) to represent the Fixed Costs line.
Step III:
Drawing the Total Revenue Line and Total Costs Line
ADVERTISEMENT
0 votes
Related Articles
Related forms


Related Categories
Parent category: Education