Graphical Approach For Cvp Analysis (Break-Even Chart) Worksheet - Chapter 3 Page 5
ADVERTISEMENT
 Worksheet - Chapter 3 Printable pdf") 1
1 2
2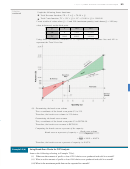 3
3 4
4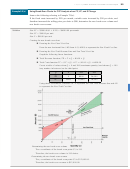 5
5 6
6 7
795
Chapter 3
| Break-Even and Cost-Volume-Profit Analysis
Using Break-Even Charts for CVP Analysis when FC, VC, and S Change
Example 3.2 (c)
Answer the following referring to Example 7.5(a).
If the fixed costs increased by 20% per month, variable costs increased by $10 per chair, and
Jonathan increased the selling price per chair to $80, determine the new break-even volume and
new break-even revenue.
Solution
New FC = $5000.00(1 + 0.20) = $6000.00 per month
New VC = $40.00 per unit
New P = $80.00 per unit
Creating the new break-even chart
■
Drawing the New Fixed Cost Line
Draw the new horizontal line (AB) from A (0, 6000) to represent the New Fixed Cost line.
■
Drawing the New Total Revenue Line and New Total Cost Line
Graph the following linear functions:
■
Total Revenue function, TR = P × Q = 80.00 × Q
■
Total Costs function TC = (VC × Q) + FC = (40.00 × Q) + 6000.00
Create a table of values when Q = 0 and 300 (maximum quantity) and choose Q = 100
(any number in between) as the third point.
0
100
300
Q
TR
0
8000
24,000
TC
6000
10,000
18,000
Using these coordinates, construct OC to represent the New Total Revenue line and AD
to represent the New Total Cost line.
Determining the new break-even volume
The x-coordinate of the break-even point (E) is 150.
Therefore, the break-even volume is 150 chairs.
Determining the new break-even revenue
The y-coordinate of the break-even point (E) is $12,000.00.
Therefore, the break-even revenue is $12,000.00.
ADVERTISEMENT
0 votes
Related Articles
Related forms


Related Categories
Parent category: Education