Graphical Approach For Cvp Analysis (Break-Even Chart) Worksheet - Chapter 3 Page 3
ADVERTISEMENT
 Worksheet - Chapter 3 Printable pdf") 1
1 2
2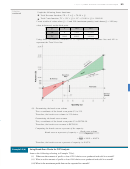 3
3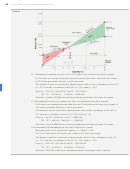 4
4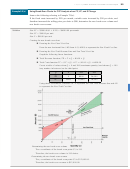 5
5 6
6 7
793
Chapter 3
| Break-Even and Cost-Volume-Profit Analysis
Solution
Graph the following linear functions:
continued
■
Total Revenue function, TR = P × Q = 70.00 × Q
■
Total Costs function, TC = (VC × Q) + FC = (30.00 × Q) + 5000.00
Create a table of values when Q = 0 and 300 (maximum quantity) and choose Q = 100 (any
value in between) as the third point.
Q
0
100
300
TR
0
7000
21,000
TC
5000
8000
14,000
Using these coordinates, construct OC to represent the Total Revenue line and AD to
represent the Total Costs line.
.
(ii) Determining the break-even volume
The x-coordinate of the break-even point (E) is 125.
Therefore, the break-even volume is 125 chairs.
Determining the break-even revenue
The y-coordinate of the break-even point (E) is $8750.00.
Therefore, the break-even revenue is $8750.00.
Computing the break-even as a percent of the capacity
Break-even volume
Break-even as a percent of capacity =
Capacity
125
=
= 41.67%
100%
#
300
Therefore, the break-even as a percent of capacity is 41.67%.
Example 3.2 (b)
Using Break-Even Charts for CVP Analysis
Answer the following referring to Example 7.5(a).
(i) What was the amount of profit or loss if 210 chairs were produced and sold in a month?
(ii) What was the amount of profit or loss if 60 chairs were produced and sold in a month?
(iii) What is the maximum profit that can be expected in a month?
ADVERTISEMENT
0 votes
Related Articles
Related forms


Related Categories
Parent category: Education