Graphical Approach For Cvp Analysis (Break-Even Chart) Worksheet - Chapter 3 Page 7
ADVERTISEMENT
 Worksheet - Chapter 3 Printable pdf") 1
1 2
2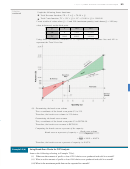 3
3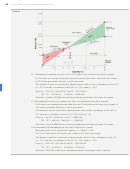 4
4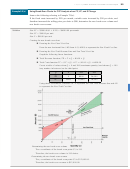 5
5 6
6 7
797
Chapter 3
| Break-Even and Cost-Volume-Profit Analysis
6.
A machine manufacturing firm sells a small component for $25 per unit. The variable costs consist of two parts:
the variable manufacturing cost is $12.50 per unit and the selling cost is $2.50 per unit. The fixed cost for the
period is $3600. The capacity is 600 units per period.
a. Draw a detailed break-even chart showing the fixed costs line, total costs line, total revenue line, break-even
point, and profit and loss areas.
b. Determine the break-even volume and break-even revenue, and compute the break-even as a percent of the
capacity.
c. What is the new break-even point in units if the fixed costs are decreased by $625 in a period and the variable
manufacturing costs per unit are increased by 10%?
7.
A new product can be sold for $165 according to market research. The variable costs are $90 per unit, fixed costs
are $8625 per period, and the production capacity is 475 units.
a. Draw a detailed break-even chart showing the fixed costs line, total costs line, total revenue line, break-even
point, and profit and loss areas.
b. Determine the break-even volume and break-even revenue, and compute the break-even as a percent of the
capacity.
c. What is the new break-even point in units when the selling price is decreased by $5 and the fixed costs per
period are increased to $10,150?
8.
A new product can be sold for $175 according to market research. The variable costs are $95 per unit, the fixed
costs are $9600 per period, and the capacity is 520 units.
a. Draw a detailed break-even chart showing the fixed costs line, total costs line, total revenue line, break-even point, and
profit and loss areas.
b. Determine the break-even volume and break-even revenue, and compute the break-even as a percent of the
capacity.
c. What is the new break-even point in units when the selling price is decreased by $5 and the fixed costs per period
are increased to $10,875?
9.
A publisher sells a new travel book for $65 per book. The fixed costs are $37,000 per year, publishing costs per
book are $40, and the royalty paid to the author is 10% of the selling price per book. The publisher has a capacity
to sell 10,000 books in a year.
a. Draw a detailed break-even chart showing the fixed costs line, total costs line, total revenue line, break-even point, and
profit and loss areas.
b. Determine the break-even volume and break-even revenue, and compute the break-even as a percent of the
capacity.
c. If the fixed costs increased by 20% per year, publishing costs increased by $5 per book, and the publisher increased the
selling price per book to $80, determine the new break-even volume and new break-even revenue.
10. A new cookbook is being sold for $25 each. The publisher’s fixed costs are $25,500 per year, publishing costs are
$14 per book, and the royalty paid to the author is 10% of the selling price. The publisher has a capacity to sell
12,000 books in a year.
a. Draw a detailed break-even chart showing the fixed costs line, total costs line, total revenue line, break-even point, and
profit and loss areas.
b. Determine the break-even volume and break-even revenue, and compute the break-even as a percent of the
capacity.
c. If the fixed costs increased by 15% per year, publishing costs increased by $6 per book, and the publisher increased
the selling price per book to $30, determine the new break-even volume and new break-even revenue.
ADVERTISEMENT
0 votes
Related Articles
Related forms


Related Categories
Parent category: Education