Graphical Approach For Cvp Analysis (Break-Even Chart) Worksheet - Chapter 3 Page 4
ADVERTISEMENT
 Worksheet - Chapter 3 Printable pdf") 1
1 2
2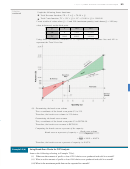 3
3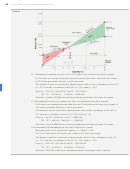 4
4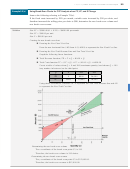 5
5 6
6 7
794
Chapter 3
| Break-Even and Cost-Volume-Profit Analysis
Solution
(i) Determining the amount of profit or loss if 210 chairs were produced and sold in a month
If 210 chairs were produced and sold, then this was 85 chairs above the break-even volume
of 125 chairs per month; therefore, a profit was made.
The amount of profit is calculated by subtracting the value for the y-coordinate in line AD
(i.e., TC), from the y-coordinate in line OC (i.e., TR), when Q = 210.
When Q = 210, TR = $14,700.00, and TC = $11,300.00
TR - TC = 14,700.00 - 11,300.00 = $3400.00
Therefore, a profit of $3400 was made by producing and selling 210 chairs in a month.
(ii) Determining the profit or loss made if 60 chairs were produced and sold in a month
If 60 chairs were produced and sold, then this was 65 chairs below the break-even volume of
125 chairs per month; therefore, a loss was incurred.
The amount of loss is calculated by subtracting the value for the y-coordinate in line AD (i.e.,
TC), from the y-coordinate in line OC (i.e., TR), when Q = 60.
When Q = 60, TR = $4200.00, and TC = $6800.00
TR - TC = 4200.00 - 6800.00 = - $2600.00
Therefore, a loss of $2600.00 was made by producing and selling 60 chairs in a month.
(iii) Determining the maximum profit that can be expected in a month
Maximum profit can be expected at capacity, i.e., when Q = 300.
This is 175 chairs above the break-even volume of 125 chairs per month.
The amount of profit is calculated by subtracting the value for the y-coordinate in line AD
(i.e., TC), from the y-coordinate in line OC (i.e., TR), when Q = 300.
When Q = 300, TR = $21,000.00 and TC = $14,000.00
TR - TC = 21,000.00 - 14,000.00 = $7000.00
Therefore, $7000.00 would be the maximum profit per month that can be expected.
ADVERTISEMENT
0 votes
Related Articles
Related forms


Related Categories
Parent category: Education