The Normal Distribution Worksheet - Oxford Insight Mathematics General Hsc General 2 Student Book Page 13
ADVERTISEMENT
 1
1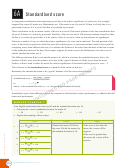 2
2 3
3 4
4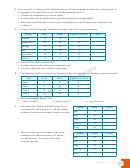 5
5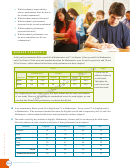 6
6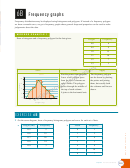 7
7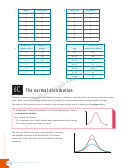 8
8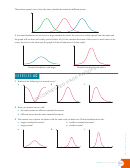 9
9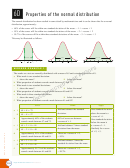 10
10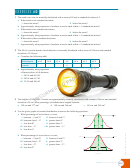 11
11 12
12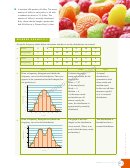 13
13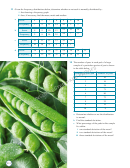 14
14 15
15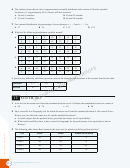 16
16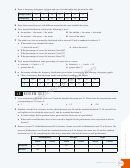 17
17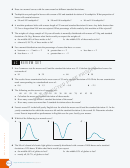 18
18 19
19 20
2010
A machine fi lls packets of lollies. The mean
number of lollies in each packet is 40 with
a standard deviation of 1.5 lollies. The
number of lollies is normally distributed.
Rory claims that he bought a packet that
had 48 lollies in it. Discuss Rory’s claim.
WORKED EXAMPLE 2
Given the frequency tables below, determine whether or not the distributions are normal.
a
Score
5
6
7
8
9
10
11
Frequency
1
7
14
18
13
5
2
b
Score
0
1
2
3
4
5
6
Frequency
3
8
15
10
16
6
2
Solve
Think
Apply
a
Draw a frequency histogram and sketch the
Calculate the mean,
A normal
frequency curve for this distribution. The curve
mode and median for the
distribution is
appears to be symmetrical and bell-shaped, but
distribution.
symmetrical with
Mean = 7.97
not perfectly so.
mean, mode and
(2 decimal places)
median equal.
20
Mode = 8
In this case all three
Median = 8
measures equal 8,
16
As the mean, mode
so it is a normal
12
and median are all
distribution.
almost exactly the
8
same, the distribution is
4
approximately normally
distributed.
0
5
6
7
8
9
10
11
Score
b
Draw a frequency histogram and sketch the
The graph is not bell-
This distribution is
frequency curve for this distribution.
shaped so the distribution
bimodal and not a
is not normal. (There is no
normal distribution.
16
need to fi nd the mean, mode
and median.)
12
8
4
0
0
1
2
3
4
5
6
Score
Chapter 6
The normal distribution
211
ADVERTISEMENT
0 votes
Related Articles
Related forms


Related Categories
Parent category: Education