The Normal Distribution Worksheet - Oxford Insight Mathematics General Hsc General 2 Student Book Page 8
ADVERTISEMENT
 1
1 2
2 3
3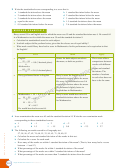 4
4 5
5 6
6 7
7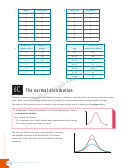 8
8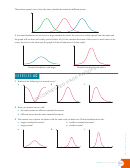 9
9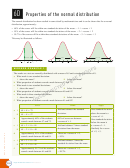 10
10 11
11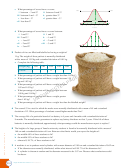 12
12 13
13 14
14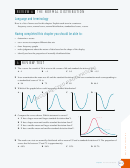 15
15 16
16 17
17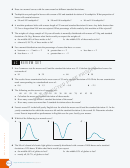 18
18 19
19 20
20Shoe size
Frequency
c
Mark
Frequency
d
3
4
0
5
4
5
1
8
5
9
2
9
6
6
3
4
4
3
7
7
5
2
8
9
6
1
9
5
Number of
Number of
Number of
e
f
minutes late
people
Age
pedestrians killed
0
55
0–9
85
1
16
10–19
30
2
10
20–29
11
3
7
30–39
22
4
4
40–49
25
5
2
50–59
41
60–69
62
6C
The normal distribution
The normal distribution
When the frequency polygon for a distribution of scores is drawn as a smooth curve, one curve in particular occurs
many times, especially for large distributions of naturally occurring characteristics such as height or weight.
The shape of this particular curve is similar to the one drawn below and it is known as the normal curve.
A distribution of scores that produces a curve with this shape is known
f
as a normal distribution.
For a normal distribution:
• The frequency curve is bell-shaped and symmetrical about the mean.
• The mean, median and mode are equal.
The size and shape of the bell are determined by the mean
f
and standard deviation of the distribution. These three
normal curves have the same mean but diff erent standard
deviations.
206
Insight Mathematics General 12
HSC Course 2
ADVERTISEMENT
0 votes
Related Articles
Related forms


Related Categories
Parent category: Education