The Normal Distribution Worksheet - Oxford Insight Mathematics General Hsc General 2 Student Book Page 4
ADVERTISEMENT
 1
1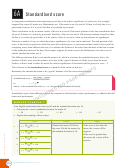 2
2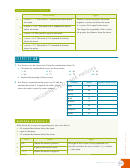 3
3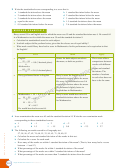 4
4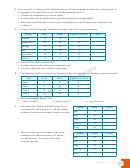 5
5 6
6 7
7 8
8 9
9 10
10 11
11 12
12 13
13 14
14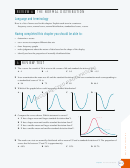 15
15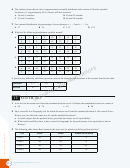 16
16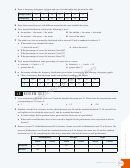 17
17 18
18 19
19 20
203
Write the standardised score corresponding to a score that is:
a
b
1 standard deviation above the mean
1 standard deviation below the mean
c
d
2 standard deviations above the mean
2 standard deviations below the mean
e
f
3 standard deviations above the mean
3 standard deviations below the mean
g
h
equal to the mean
1.5 standard deviations above the mean
i
j
0.8 standard deviations below the mean
2.6 standard deviations below the mean.
WORKED EXAMPLE 3
Harry scored 55 in an English test for which the mean was 50 and the standard deviation was 6. He scored 64
in a Mathematics test for which the mean was 59 and the standard deviation 9.
a
Calculate his standardised score for each subject.
b
In which subject did he perform better, given that the classes are of equal ability?
c
What mark would Harry have had to score in Mathematics for his performance to be equivalent to that
for English?
Solve
Think
Apply
a
English
Scores for both subjects are above
The z-score allows
55 − 50
_______
the mean, so both are positive.
comparisons between
z =
= 0.8 (1 decimal place)
6
results with diff erent
Mathematics
means and standard
64 − 59
_______
z =
= 0.6 (1 decimal place)
deviations. The
9
number of students
b
Harry performed better in English.
Harry’s score for English was 0.8
in each class does not
standard deviations above the mean.
have to be the same.
His score for Mathematics was 0.6
standard deviations above the mean.
He performed slightly better in
English than in Mathematics.
Mathematics = 59 + 0.8 × 9 = 66
c
Harry’s score would have to be 0.8
M − 59
_______
standard deviations above the mean
= 0.8
or
9
for Mathematics.
M − 59 = 7.2
M = 66.2
He would have had to score 66.
4
In an examination the mean was 65 and the standard deviation 10. Write the raw examination mark
corresponding to these standardised scores:
−1
−2
−3
a
b
c
d
e
f
1
2
3
−1.5
−2.3
g
h
i
j
k
l
0
1.5
0.8
2.7
5
The following are marks scored in a Geography test:
57, 58, 56, 47, 62, 74, 60, 55, 33, 85, 63, 71, 58, 40, 55
a
Calculate the mean and standard deviation of the marks in this test.
b
Calculate the z-score for each mark.
c
How many of the marks are within 1 standard deviation of the mean? (That is, how many had a z-score
between −1 and 1?)
d
What percentage of the marks lie within 1 standard deviation of the mean?
e
What percentage of the marks are within 2 standard deviations of the mean?
f
What percentage of the marks are more than 2 standard deviations from the mean?
202
Insight Mathematics General 12
HSC Course 2
ADVERTISEMENT
0 votes
Related Articles
Related forms


Related Categories
Parent category: Education