The Normal Distribution Worksheet - Oxford Insight Mathematics General Hsc General 2 Student Book Page 15
ADVERTISEMENT
 1
1 2
2 3
3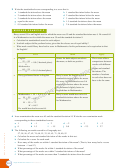 4
4 5
5 6
6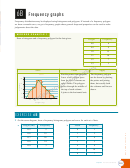 7
7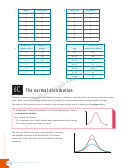 8
8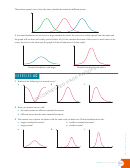 9
9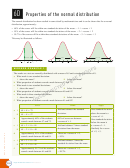 10
10 11
11 12
12 13
13 14
14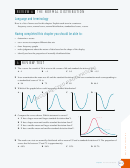 15
15 16
16 17
17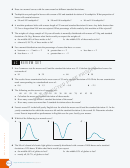 18
18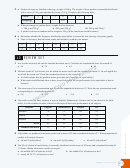 19
19 20
20REVIEW 6
THE NORMAL DISTRIBUTION
Language and terminology
Here is a list of terms used in this chapter. Explain each term in a sentence.
frequency curve, normal curve, normal distribution, standardised score, z-score
Having completed this chapter you should be able to:
• determine z-scores
• use z-scores to compare diff erent data sets
• draw frequency graphs
• make judgements about the nature of data based on the shape of the display
• identify and use the properties of normally distributed data.
6
REVIEW TEST
1 The z-score for a mark of 56 in a test with a mean of 60 and standard deviation of 8 is:
B −4
D −0.5
A 4
C 0.5
2 In an examination the mean was 65 and the standard deviation 15. The raw examination mark corresponding to
a standardised score of 1.4 is:
A 86
B 79
C 80
D 66.4
3 Which of the graphs below could represent a normal distribution?
A
f
B
C
f
D
f
f
4 Compare the curves shown. Which statement is correct?
f
curve X
A X has a larger mean and larger standard deviation than Y.
B X has a larger mean and smaller standard deviation than Y.
C X has a smaller mean and larger standard deviation than Y.
D X has a smaller mean and smaller standard deviation than Y.
curve Y
5 The marks on a test are normally distributed with a mean of 55 and a standard deviation of 9. The proportion of
scores that lie between 37 and 73 is approximately:
A 68%
B 86%
C 95%
D 99.7%
Chapter 6
The normal distribution
213
ADVERTISEMENT
0 votes
Related Articles
Related forms


Related Categories
Parent category: Education