The Normal Distribution Worksheet - Oxford Insight Mathematics General Hsc General 2 Student Book Page 17
ADVERTISEMENT
 1
1 2
2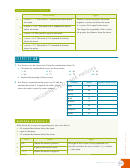 3
3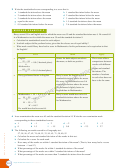 4
4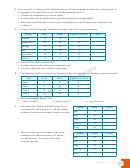 5
5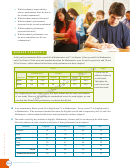 6
6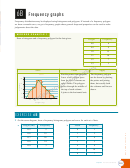 7
7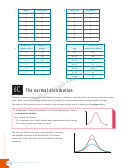 8
8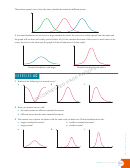 9
9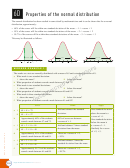 10
10 11
11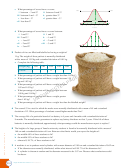 12
12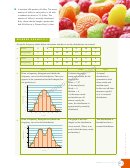 13
13 14
14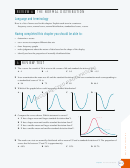 15
15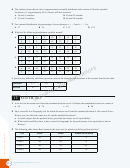 16
16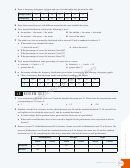 17
17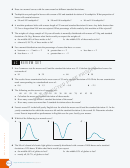 18
18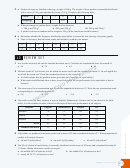 19
19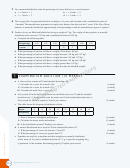 20
204 Draw a frequency histogram, polygon and curve for the height data given in the table.
Height (cm)
16
17
18
19
20
21
22
Frequency
4
9
15
21
16
10
3
5 Draw three normal curves with diff erent means but the same standard deviation.
6 For a normal distribution, which of the following is true?
A the median < the mean < the mode
B the median = the mean = the mode
C the median > the mean > the mode
D none of the above
7 The marks on a test are normally distributed with a mean of 63 and a standard deviation of 5.
a What mark is one standard deviation:
i
ii
above the mean?
below the mean?
b What percentage of scores lie between 58 and 68?
c What percentage of scores lie between 53 and 73?
d What percentage of scores lie between 48 and 78?
8 For a normal distribution, what percentage of scores have a z-score:
a between z = 0 and z = 1?
b between z = −1 and z = 0?
c greater than 0?
d greater than 1?
9 a Determine whether the frequency distribution given below is normal by fi rst drawing a frequency graph.
b Then, if necessary, fi nd the mean, mode and median to confi rm your answer.
x
10
11
12
13
14
15
16
17
18
f
2
6
12
19
25
18
11
6
3
6B
REVIEW SET
1 In an examination the mean mark was 70 and the standard deviation was 10. Write down the examination mark
corresponding to a z-score of:
b −1
d −2.6
a 2
c 1.3
2 Matthew scored 62 in a Science test for which the mean was 50 and the standard deviation 12. He scored 58 in
an English test for which the mean was 51 and the standard deviation 8.
a In which subject did he perform better, given that the classes are of equal ability?
b What mark would Matthew have to have scored in English for his performance to be equivalent to that in
Science?
3 Rebecca scored 72 in Mathematics and 69 in Science. Serena scored 66 in Mathematics and 75 in Science. The
mean in Mathematics was 60 and the standard deviation was 8. In Science the mean was 65 and the standard
deviation was 10. By completing the table below, determine who had the better overall performance.
Mathematics
Science
Total
Mark
z-score
Mark
z-score
Mark
z-score
Rebecca
72
69
Serena
66
75
Chapter 6
The normal distribution
215
ADVERTISEMENT
0 votes
Related Articles
Related forms


Related Categories
Parent category: Education