The Normal Distribution Worksheet - Oxford Insight Mathematics General Hsc General 2 Student Book Page 7
ADVERTISEMENT
 1
1 2
2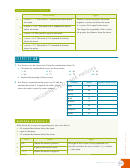 3
3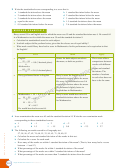 4
4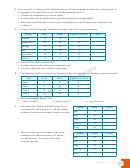 5
5 6
6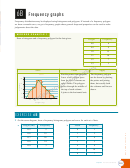 7
7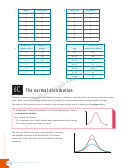 8
8 9
9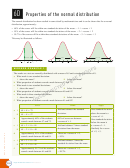 10
10 11
11 12
12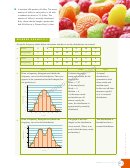 13
13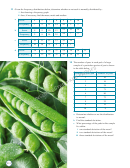 14
14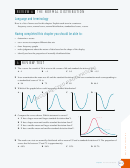 15
15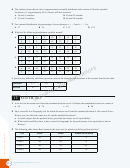 16
16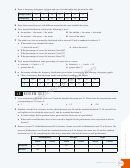 17
17 18
18 19
19 20
206B
Frequency graphs
Frequency graphs
Frequency distributions may be displayed using histograms and polygons. If instead of a frequency polygon
we draw a smooth curve, we get a frequency graph whose general shape and properties can be used to make
judgements about the data.
WORKED EXAMPLE 1
Draw a histogram and a frequency polygon for the data given.
Weight
Frequency
48
6
49
9
50
15
51
10
52
7
53
3
Solve
Apply
Think
Plot the points from the table.
The frequency polygon
Scores
Leave a half column space
can be drawn by plotting
16
Frequency polygon
from the axis. Columns are
the points and joining
12
equal widths. The polygon
them, but usually both
passes through the middle of
the columns and line are
8
the top of each column.
drawn.
It joins to the horizontal axis.
4
0
48
49
50
51
52
53
Weight (kg)
EXERCISE 6B
1
On the same diagram, draw a frequency histogram, polygon and curve for each set of data.
a
Height (cm)
Frequency
b
Mark
Frequency
155
5
0
1
156
25
1
2
157
26
2
4
158
24
3
5
159
3
4
8
5
10
6
7
Chapter 6
The normal distribution
205
ADVERTISEMENT
0 votes
Related Articles
Related forms


Related Categories
Parent category: Education