The Normal Distribution Worksheet - Oxford Insight Mathematics General Hsc General 2 Student Book Page 2
ADVERTISEMENT
 1
1 2
2 3
3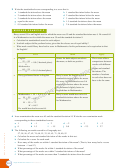 4
4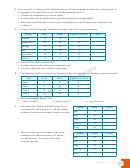 5
5 6
6 7
7 8
8 9
9 10
10 11
11 12
12 13
13 14
14 15
15 16
16 17
17 18
18 19
19 20
206A
Standardised score
Standardised score
An important consideration when analysing sets of data is the relative signifi cance of each score. For example,
suppose Kim scores 40 marks in a Mathematics test. If the mark is out of a total of 50 then it is likely that it is a
good mark; however, if it is out of 100 then it is probably a poor mark.
These conclusions are by no means certain. If the test was out of 50 and most students in the class scored more than
40 out of 50 then it is a relatively poor mark. Similarly, if the test was out of 100 and most students scored less than
40 then it is a relatively good mark: it is the relative value of a score in a data set that indicates its signifi cance.
There are a number of ways in which the relative signifi cance of a score can be indicated. The rank position of the
score, or the decile or quartile in which the score lies could be given. A convenient method, which is also useful for
comparing scores from diff erent data sets, is to indicate the distance of the score from the mean of the data in terms
of the standard deviation of the data. For example, suppose the mean score in the Mathematics test above was 56
and the standard deviation was 8.
The diff erence between Kim’s score and the mean is 16, which is two times the standard deviation; that is, the
distance of Kim’s score from the mean is twice that of the ‘typical’ distance of all the scores from the mean.
Further, as Kim’s mark is below the mean, the relative signifi cance of her mark could be given as a score −2.
This is known as the standardised score or z-score for Kim’s mark on this test.
Remember, the standard deviation is the ‘typical’ distance of all the scores from the mean.
raw score − mean
_______________
Standardised score =
standard deviation
x − x
_____
z =
or
s
where s is the standard deviation (s =
for population standard deviation).
n
Standardised scores from diff erent tests can be compared to fi nd the better relative performance, or added to fi nd the
better total performance.
WORKED EXAMPLE 1
In an English examination the mean was 60 and the standard deviation was 10.
a
Calculate the z-score (standardised scores) for marks of:
i
ii
iii
iv
v
50
58
60
64
83
b
Explain the meaning of these scores.
Solve
Think
Apply
50 − 60
If the score is less than the
_______
Subtract the mean of 60 from
z =
= −1
a
i
10
mean, the z-score will be
the score. Divide the answer by
58 − 60
negative.
_______
the standard deviation of 10.
z =
= −0.2
ii
10
If the score is greater than
60 − 60
the mean, the z-score will be
_______
z =
= 0
iii
10
positive.
64 − 60
_______
z =
= 0.4
iv
10
83 − 60
_______
z =
= 2.3
v
10
200
Insight Mathematics General 12
HSC Course 2
ADVERTISEMENT
0 votes
Related Articles
Related forms


Related Categories
Parent category: Education