Performance And Accountability Report - Fiscal Year 2013 - Federal Aviation Administration - U.s. Department Of Transportation Page 112
ADVERTISEMENT
 1
1  2
2  3
3  4
4  5
5  6
6  7
7  8
8  9
9  10
10  11
11  12
12  13
13  14
14  15
15  16
16  17
17  18
18  19
19  20
20  21
21  22
22  23
23  24
24  25
25  26
26  27
27  28
28  29
29  30
30  31
31  32
32  33
33  34
34  35
35  36
36  37
37  38
38  39
39  40
40  41
41  42
42  43
43  44
44  45
45  46
46  47
47  48
48  49
49  50
50  51
51  52
52  53
53  54
54 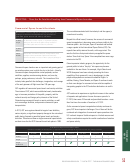 55
55  56
56  57
57  58
58  59
59 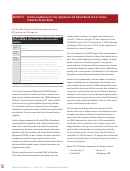 60
60  61
61  62
62  63
63  64
64  65
65  66
66  67
67  68
68  69
69  70
70  71
71  72
72  73
73  74
74  75
75  76
76  77
77  78
78  79
79  80
80  81
81  82
82  83
83  84
84  85
85 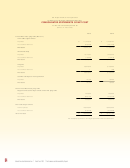 86
86  87
87 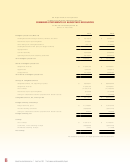 88
88  89
89  90
90  91
91  92
92  93
93  94
94  95
95  96
96  97
97 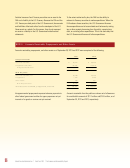 98
98 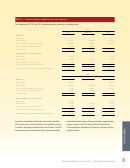 99
99  100
100  101
101  102
102  103
103 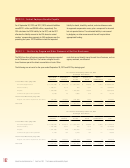 104
104 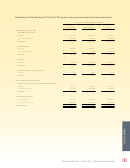 105
105  106
106  107
107  108
108  109
109 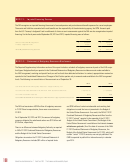 110
110  111
111 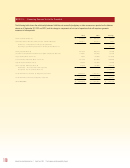 112
112  113
113 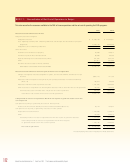 114
114 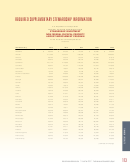 115
115 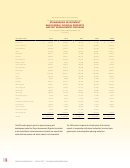 116
116  117
117  118
118  119
119  120
120  121
121  122
122  123
123  124
124  125
125  126
126  127
127  128
128  129
129  130
130  131
131  132
132  133
133  134
134 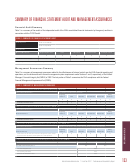 135
135  136
136  137
137  138
138  139
139  140
140  141
141 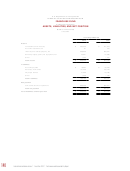 142
142 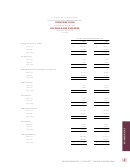 143
143 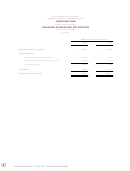 144
144  145
145  146
146  147
147  148
148  149
149  150
150 NOTE 15. Financing Sources Yet to Be Provided
The following table shows the relationship between liabilities not covered by budgetary or other resources as reported on the balance
sheets as of September 30, 2013 and 2012, and the change in components of net cost of operations that will require or generate
resources in future periods.
2013
2012
Change
FECA actuarial (Note 10)
$
973,055
$
946,778
$
26,277
Unfunded annual & other leave & assoc. benefits (Note 8)
407,611
404,714
2,897
Increases – components of net cost of operations
requiring or generating resources in future periods (Note 17)
29,174
FECA payable (Note 8)
201,322
206,118
(4,796)
Sick leave compensation benefits for eligible employees (Note 8)
118,981
126,703
(7,722)
Legal claims (Note 8 and 16)
2,667
34,300
(31,633)
Environmental liabilities (Note 7 and 16)
751,705
810,399
(58,694)
Capital Leases (Note 8 and 9)
78,005
82,304
(4,299)
Other accrued liabilities (Note 8)
47,026
95,896
(48,870)
Decreases – resources that fund expenses
recognized in prior periods (Note 17)
(156,014)
Total liabilities not covered by budgetary resources
2,580,372
2,707,212
(126,840)
Total liabilities covered by budgetary resources
1,775,477
1,670,810
104,667
Total liabilities
$ 4,355,849
$ 4,378,022
$
(22,173)
110
|
|
Federal Aviation Administration
Fiscal Year 2013
Performance and Accountability Report
ADVERTISEMENT
0 votes
Related Articles
Related forms
 Form Hud-2063 - Schedule Of Federal Housing Administration Debentures Authorized And Requisitioned - Original Issue - Office Of Housing Federal Housing Commissioner - U.s. Department Of Housing And Urban Development
Legal
Form Hud-2063 - Schedule Of Federal Housing Administration Debentures Authorized And Requisitioned - Original Issue - Office Of Housing Federal Housing Commissioner - U.s. Department Of Housing And Urban Development
Legal
 Form 4530 - Registration And Amendments Of Foreign Charter Operators Under Part 380 Of The Regulations Of The Department Of Transportation - U.s. Department Of Transportation
Legal
Form 4530 - Registration And Amendments Of Foreign Charter Operators Under Part 380 Of The Regulations Of The Department Of Transportation - U.s. Department Of Transportation
Legal


 - U.s. Department Of Transportation") Faa Form 8110-26 - Supplemental Type Inspection Report (stir) - U.s. Department Of Transportation
Legal
Faa Form 8110-26 - Supplemental Type Inspection Report (stir) - U.s. Department Of Transportation
Legal
 Form Hud-2537 - Mortgagee's Application For Partial Settlement - Multifamily Mortgage - Office Of Housing Federal Housing Commissioner - U.s. Department Of Housing And Urban Development
Legal
Form Hud-2537 - Mortgagee's Application For Partial Settlement - Multifamily Mortgage - Office Of Housing Federal Housing Commissioner - U.s. Department Of Housing And Urban Development
Legal


Related Categories
Parent category: Business