Performance And Accountability Report - Fiscal Year 2013 - Federal Aviation Administration - U.s. Department Of Transportation Page 66
ADVERTISEMENT
 1
1  2
2  3
3  4
4  5
5  6
6  7
7  8
8  9
9  10
10  11
11  12
12  13
13 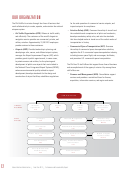 14
14  15
15  16
16  17
17  18
18  19
19 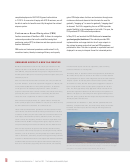 20
20  21
21  22
22  23
23  24
24  25
25  26
26  27
27  28
28  29
29  30
30  31
31  32
32  33
33  34
34  35
35  36
36  37
37  38
38  39
39  40
40  41
41  42
42  43
43  44
44 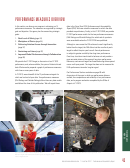 45
45 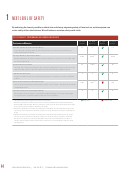 46
46 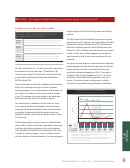 47
47 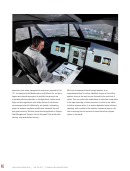 48
48  49
49 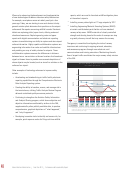 50
50 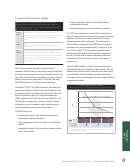 51
51 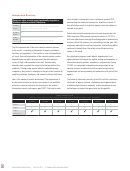 52
52 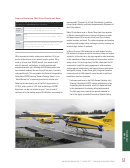 53
53 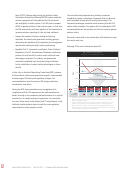 54
54 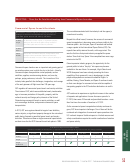 55
55  56
56  57
57  58
58 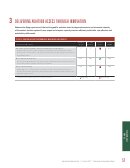 59
59 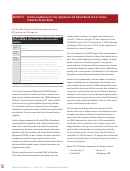 60
60  61
61  62
62  63
63  64
64 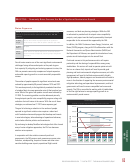 65
65 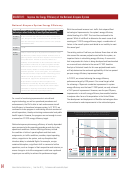 66
66  67
67  68
68  69
69  70
70  71
71  72
72  73
73  74
74  75
75  76
76  77
77  78
78  79
79  80
80  81
81  82
82  83
83  84
84  85
85  86
86  87
87  88
88  89
89  90
90  91
91  92
92  93
93  94
94  95
95 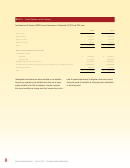 96
96  97
97  98
98 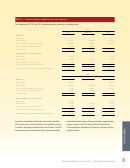 99
99  100
100  101
101  102
102  103
103  104
104  105
105  106
106 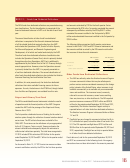 107
107  108
108  109
109 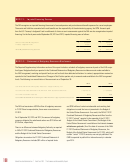 110
110 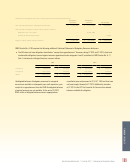 111
111  112
112  113
113  114
114  115
115 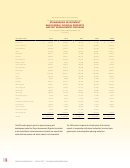 116
116 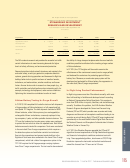 117
117  118
118  119
119 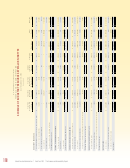 120
120  121
121  122
122  123
123  124
124  125
125  126
126  127
127  128
128  129
129  130
130  131
131  132
132  133
133  134
134  135
135  136
136  137
137 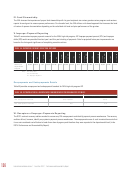 138
138  139
139  140
140  141
141  142
142  143
143 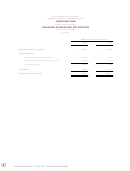 144
144 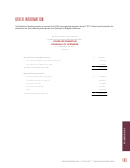 145
145  146
146  147
147  148
148  149
149  150
150 OBJECTIVE: Improve the Energy Efficiency of the National Airspace System
National Airspace System Energy Efficiency
With the continued increase in air traffic that outpaced fleet
Improve national airspace system energy efficiency (fuel
technological improvements, the system’s energy efficiency
burned per miles flown) by at least 2 percent annually.
started leveling off in 2007. This trend has continued to the
FY 2013
Improve aviation fuel efficiency by at least 2 percent per
Target
present. While it is difficult to determine the exact cause of not
year, through FY 2025, as measured by the calendar year
2012 fuel burned per miles flown, relative to the calendar
meeting our FY 2013 energy efficiency target, a combination of
year 2000 baseline.
factors in the overall system contributed to our inability to meet
FY 2013
-15.61
this annual goal.
Result
The existing metric of fuel burn per distance flown does not take
Public
Today’s aircraft are up to 70 percent more efficient in fuel
Benefit
use than early commercial jet aircraft. However, there is
into account the revenue payload moved within the system, an
growing concern over aviation’s impact on the environment
important factor in calculating energy efficiency. A new metric
and public health. Aviation is currently viewed as a
that incorporates this factor is being developed and benchmarked
relatively small contributor to those emissions that have
the potential to influence air quality and global climate.
on an annual basis relative to the current FY 2001 baseline.
Carbon dioxide emissions are a primary greenhouse gas
Analysis of historical trends for this new payload-based metric
and are directly related to the fuel burned during the
will help determine the continued applicability of the two percent
aircraft’s operation. As air traffic grows, this contribution
will increase without improvements in technology, more
per year energy efficiency improvement target.
efficient air traffic operations, and renewable fuels.
In FY 2013, we missed achieving the energy efficiency
This measure supports the development of these
improvements to reduce aviation’s impact on the
performance target by 0.39 percent. Our annual target called
environment and thereby improve public health and
for achieving a 16 percent cumulative improvement in system
welfare. In addition, more fuel efficient aircraft should
energy efficiency over the base FY 2001 period; we only achieved
contribute to improving the financial well-being of
commercial airlines and a growing economy.
a 15.61 percent improvement. However, over the past 20 years,
improvements in aircraft energy efficiency have enabled aviation
to outpace other forms of transportation in the United States.
As a result of monitoring improvements in aircraft and
The development and deployment of NextGen technologies allow
engine technology, as well as operational procedures and
us to continue to make improvements in the national airspace
enhancements, the FAA is able to track and measure aircraft
fuel efficiency in the national airspace system. In FY 2013, we
continued to make progress in maintaining efficient commercial
National Airspace System Energy Efficiency
aircraft operations, thereby minimizing environmental and public
Cumulative percentage reduction from baseline
health impacts. However, the progress was not enough to meet
or exceed our FY 2013 energy efficiency target.
-5
National airspace system energy efficiency is heavily dependent
upon commercial airline operating procedures and day-to-day
-10
operational conditions. Factors affecting efficiency include
the condition of airlines’ operating fleets and their route
assignments, air traffic conditions, weather, airport operating
-15
status, congestion in the system, and any disruptions that
introduce delay in scheduled flights. For example, a major
sustained disruption, a significant shift in commercial airline
-20
FY 2008
FY 2009
FY 2010
FY 2011
FY 2012
FY 2013
operations, such as changes in fleet composition and missions, or
-13.52
-14.03
-15.25
-14.50
-14.76
-15.61
Actual
even a change in air traffic management could have a profound
-9.00
-8.00
-10.00
-12.00
-14.00
-16.00
Target
impact upon our ability to achieve this performance target.
Target
Achieved?
64
|
|
Federal Aviation Administration
Fiscal Year 2013
Performance and Accountability Report
ADVERTISEMENT
0 votes
Related Articles
Related forms
 Form Hud-2063 - Schedule Of Federal Housing Administration Debentures Authorized And Requisitioned - Original Issue - Office Of Housing Federal Housing Commissioner - U.s. Department Of Housing And Urban Development
Legal
Form Hud-2063 - Schedule Of Federal Housing Administration Debentures Authorized And Requisitioned - Original Issue - Office Of Housing Federal Housing Commissioner - U.s. Department Of Housing And Urban Development
Legal
 Form 4530 - Registration And Amendments Of Foreign Charter Operators Under Part 380 Of The Regulations Of The Department Of Transportation - U.s. Department Of Transportation
Legal
Form 4530 - Registration And Amendments Of Foreign Charter Operators Under Part 380 Of The Regulations Of The Department Of Transportation - U.s. Department Of Transportation
Legal


 - U.s. Department Of Transportation") Faa Form 8110-26 - Supplemental Type Inspection Report (stir) - U.s. Department Of Transportation
Legal
Faa Form 8110-26 - Supplemental Type Inspection Report (stir) - U.s. Department Of Transportation
Legal
 Form Hud-2537 - Mortgagee's Application For Partial Settlement - Multifamily Mortgage - Office Of Housing Federal Housing Commissioner - U.s. Department Of Housing And Urban Development
Legal
Form Hud-2537 - Mortgagee's Application For Partial Settlement - Multifamily Mortgage - Office Of Housing Federal Housing Commissioner - U.s. Department Of Housing And Urban Development
Legal


Related Categories
Parent category: Business