Performance And Accountability Report - Fiscal Year 2013 - Federal Aviation Administration - U.s. Department Of Transportation Page 27
ADVERTISEMENT
 1
1  2
2  3
3  4
4  5
5  6
6  7
7  8
8  9
9  10
10  11
11  12
12 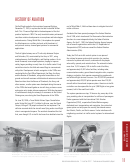 13
13  14
14  15
15  16
16  17
17  18
18  19
19 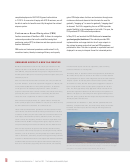 20
20 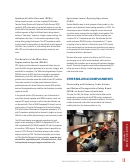 21
21 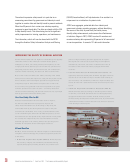 22
22  23
23  24
24  25
25 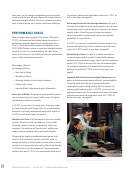 26
26 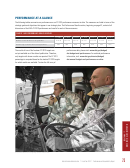 27
27  28
28  29
29  30
30 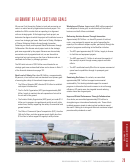 31
31  32
32  33
33  34
34  35
35  36
36  37
37  38
38  39
39  40
40  41
41  42
42  43
43  44
44 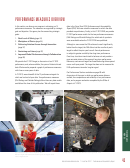 45
45 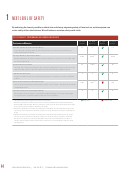 46
46  47
47  48
48  49
49 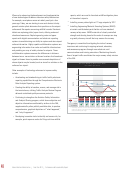 50
50  51
51  52
52 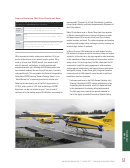 53
53 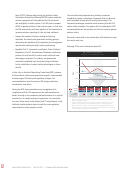 54
54 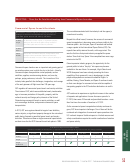 55
55 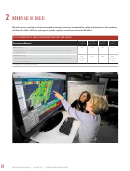 56
56  57
57 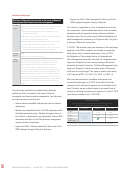 58
58  59
59 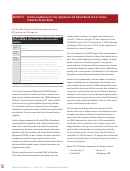 60
60  61
61  62
62 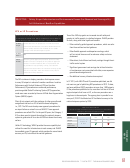 63
63 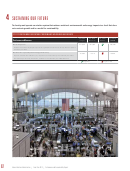 64
64  65
65 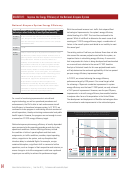 66
66  67
67  68
68  69
69 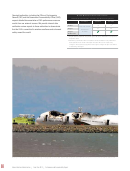 70
70  71
71  72
72  73
73  74
74  75
75  76
76  77
77  78
78  79
79  80
80  81
81  82
82  83
83  84
84  85
85  86
86 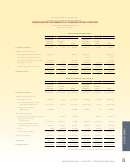 87
87 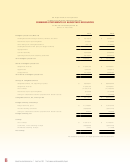 88
88  89
89  90
90  91
91  92
92  93
93  94
94  95
95 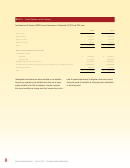 96
96 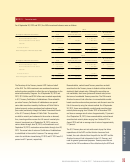 97
97 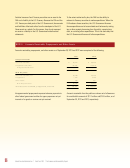 98
98 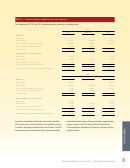 99
99 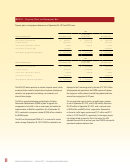 100
100  101
101  102
102  103
103 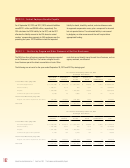 104
104 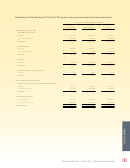 105
105 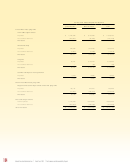 106
106 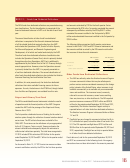 107
107  108
108  109
109  110
110  111
111 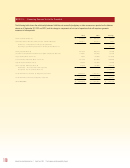 112
112  113
113  114
114 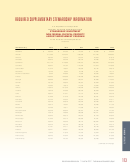 115
115 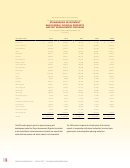 116
116 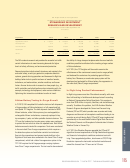 117
117  118
118  119
119 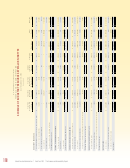 120
120 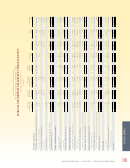 121
121  122
122  123
123  124
124  125
125  126
126  127
127  128
128  129
129  130
130  131
131  132
132  133
133  134
134 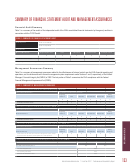 135
135  136
136  137
137 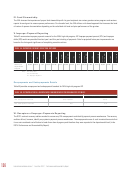 138
138  139
139  140
140  141
141  142
142 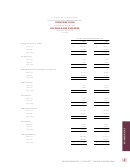 143
143 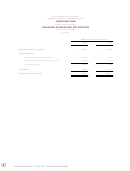 144
144 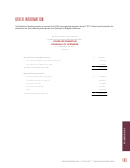 145
145  146
146  147
147  148
148  149
149  150
150 PERFORMANCE AT A GLANCE
The following tables summarize our performance on our FY 2013 performance measures to date. The measures are listed in terms of the
strategic goals and objectives that appear in our strategic plan. The Performance Results section, beginning on page 42, contains full
discussions of the FAA’s FY 2013 performance and results for each of these measures.
YEAR TO YEAR PERFORMANCE GOALS ACHIEVED
FY 2007
FY 2008
FY 2009
FY 2010
FY 2011
FY 2012
FY 2013
Number of Performance Targets Met
24 of 30
26 of 29
28 of 31
28 of 31
27 of 29
13 of 14
8 of 12
Percentage of Performance Targets Met
80%
90%
90%
90%
93%
93%
67%
performance data, please visit:
The results of two of the fourteen FY 2013 targets are
not yet available as of the date of publication. Therefore,
dot-budget-and-performance. For archived performance
information, visit:
only targets with known results are reported. The FY 2013
percentage is computed based on the twelve FY 2013 targets
dot-annual-budget-and-performance-archive.
for which results are available. To view the full array of
Aircraft Rescue and Fire Fighting vehicle. Photo: FAA.
25
|
|
Federal Aviation Administration
Fiscal Year 2013
Performance and Accountability Report
ADVERTISEMENT
0 votes
Related Articles
Related forms
 Form Hud-2063 - Schedule Of Federal Housing Administration Debentures Authorized And Requisitioned - Original Issue - Office Of Housing Federal Housing Commissioner - U.s. Department Of Housing And Urban Development
Legal
Form Hud-2063 - Schedule Of Federal Housing Administration Debentures Authorized And Requisitioned - Original Issue - Office Of Housing Federal Housing Commissioner - U.s. Department Of Housing And Urban Development
Legal
 Form 4530 - Registration And Amendments Of Foreign Charter Operators Under Part 380 Of The Regulations Of The Department Of Transportation - U.s. Department Of Transportation
Legal
Form 4530 - Registration And Amendments Of Foreign Charter Operators Under Part 380 Of The Regulations Of The Department Of Transportation - U.s. Department Of Transportation
Legal


 - U.s. Department Of Transportation") Faa Form 8110-26 - Supplemental Type Inspection Report (stir) - U.s. Department Of Transportation
Legal
Faa Form 8110-26 - Supplemental Type Inspection Report (stir) - U.s. Department Of Transportation
Legal
 Form Hud-2537 - Mortgagee's Application For Partial Settlement - Multifamily Mortgage - Office Of Housing Federal Housing Commissioner - U.s. Department Of Housing And Urban Development
Legal
Form Hud-2537 - Mortgagee's Application For Partial Settlement - Multifamily Mortgage - Office Of Housing Federal Housing Commissioner - U.s. Department Of Housing And Urban Development
Legal


Related Categories
Parent category: Business