Supply And Demand - Chapter 3 Page 12
ADVERTISEMENT
 1
1 2
2 3
3 4
4 5
5 6
6 7
7 8
8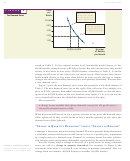 9
9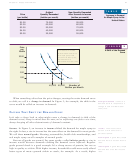 10
10 11
11 12
12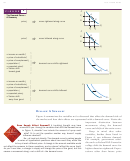 13
13 14
14 15
15 16
16 17
17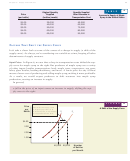 18
18 19
19 20
20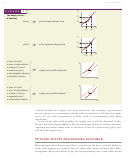 21
21 22
22 23
23 24
24 25
25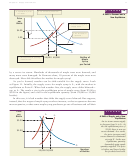 26
26 27
27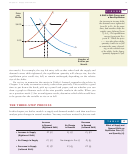 28
28 29
29 30
30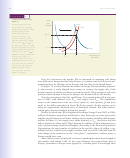 31
31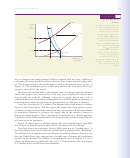 32
32 33
33 34
34 35
35 36
36 37
37Chapter 3: Supply and Demand
63
A rise in the price of a complement decreases the demand for a good,
shifting the demand curve to the left.
For this reason, we’d expect a higher price for automobiles to decrease the demand
for gasoline. (To test yourself: How would a lower price for milk affect the demand
for breakfast cereal?)
Population. As the population increases in an area, the number of buyers will ordi-
narily increase as well, and the demand for a good will increase. The growth of the
U.S. population over the last 50 years has been an important reason (but not the
only reason) for rightward shifts in the demand curves for food, housing, automo-
biles, and many other goods and services.
Expected Price. If buyers expect the price of maple syrup to rise next month, they
may choose to purchase more now to stock up before the price hike. If people expect
the price to drop, they may postpone buying, hoping to take advantage of the lower
price later.
In many markets, an expectation that price will rise in the future shifts the
current demand curve rightward, while an expectation that price will fall
shifts the current demand curve leftward.
Expected price changes are especially important in the markets for financial
assets such as stocks and bonds and in the market for real estate. People want to
buy more stocks, bonds, and real estate when they think their prices will rise in the
near future. This shifts the demand curves for these items to the right.
Tastes. Suppose we know the number of buyers in the United States, their expecta-
tions about the future price of maple syrup, the prices of all related goods, and the
average levels of income and wealth. Do we have all the information we need to
draw the demand curve for maple syrup? Not really. Because we have not yet con-
sidered the psychological component—the habits and tastes that determine the basic
desire people have for maple syrup. How many Americans eat breakfast every day?
Of these, how many eat pancakes or waffles? How often? How many of them like
maple syrup, and how much do they like it? And what about all of the other goods
and services competing for consumers’ dollars: How do buyers feel about them?
The questions could go on and on, pinpointing various characteristics about buy-
ers that influence their attitudes toward maple syrup. The approach of economics is
to lump all of these characteristics of buyers together and call them, simply, tastes or
preferences. Economists are sometimes interested in where these tastes come from or
what makes them change. But for the most part, economics deals with the conse-
quences of a change in tastes, whatever the reason for its occurrence.
When tastes change toward a good (people favor it more), demand increases,
and the demand curve shifts to the right. When tastes change away from a good,
demand decreases, and the demand curve shifts to the left. An example of this is the
change in tastes away from cigarettes over the past several decades. The cause may
have been an aging population, a greater concern about health among people of all
ages, or successful antismoking advertising. But regardless of the cause, the effect
has been to decrease the demand for cigarettes, shifting the demand curve to the left.
ADVERTISEMENT
0 votes
Related Articles
Related forms


Related Categories
Parent category: Education