Supply And Demand - Chapter 3 Page 23
ADVERTISEMENT
 1
1 2
2 3
3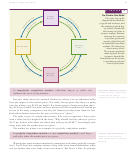 4
4 5
5 6
6 7
7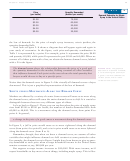 8
8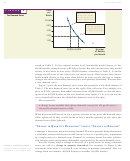 9
9 10
10 11
11 12
12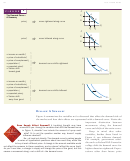 13
13 14
14 15
15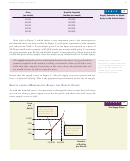 16
16 17
17 18
18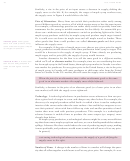 19
19 20
20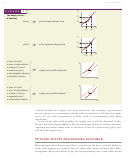 21
21 22
22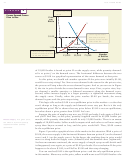 23
23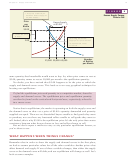 24
24 25
25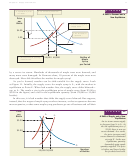 26
26 27
27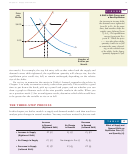 28
28 29
29 30
30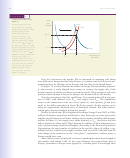 31
31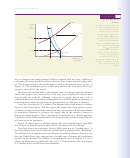 32
32 33
33 34
34 35
35 36
36 37
3774
Part I: Preliminaries
8
F I G U R E
2. causes the price
to rise …
Excess Demand Causes
Price
Price to Rise
per
Bottle
S
E
3. shrinking the excess
$3.00
demand until price
reaches its equilibrium
value of $3.00.
Excess
H
J
1.00
Demand
D
1. At a price of $1.00 per
bottle an excess demand
Number
25,000
50,000
75,000
of 50,000 bottles …
of Bottles
per Month
of 25,000 bottles is found at point H on the supply curve, while quantity demand-
ed is at point J on the demand curve. The horizontal difference between the two
curves at $1.00 is a graphical representation of the excess demand at that price.
At this point, we should ask another question: If the price were initially $1.00,
would it ever stop rising? Yes. Since excess demand is the reason for the price to rise,
the process will stop when the excess demand is gone. And as you can see in Figure
8, the rise in price shrinks the excess demand in two ways. First, as price rises, buy-
ers demand a smaller quantity—a leftward movement along the demand curve.
Second, sellers increase supply to a larger quantity—a rightward movement along
the supply curve. Finally, when the price reaches $3.00 per bottle, the excess
demand is gone and the price stops rising.
This logic tells us that $3.00 is an equilibrium price in this market—a value that
won’t change as long as the supply and demand curves stay put. But is it the only
equilibrium price? We’ve shown that any price below $3.00 is not an equilibrium,
but what about a price greater than $3.00? Let’s see.
Suppose the price of maple syrup was, say, $5.00 per bottle. Look again at Table 5
and you’ll find that, at this price, quantity supplied would be 65,000 bottles per
month, while quantity demanded would be only 35,000 bottles. There is an excess
Excess supply
At a given price,
supply of 30,000 bottles. Sellers would compete with each other to sell more maple
the amount by which quantity
supplied exceeds quantity
syrup than buyers wanted to buy, and the price would fall. Thus, $5.00 cannot
demanded.
be the equilibrium price.
Figure 9 provides a graphical view of the market in this situation. With a price of
$5.00, the excess supply is the horizontal distance between points K (on the demand
curve) and L (on the supply curve). In the figure, the resulting drop in price would
move us along both the supply curve (leftward) and the demand curve (rightward).
As these movements continued, the excess supply of maple syrup would shrink until
it disappeared, once again, at a price of $3.00 per bottle. Our conclusion: If the price
happens to be above $3.00, it will fall to $3.00 and then stop changing.
You can see that $3.00 is the equilibrium price—and the only equilibrium price—
in this market. Moreover, at this price, sellers would want to sell 50,000 bottles—the
ADVERTISEMENT
0 votes
Related Articles
Related forms


Related Categories
Parent category: Education