Supply And Demand - Chapter 3 Page 35
ADVERTISEMENT
 1
1 2
2 3
3 4
4 5
5 6
6 7
7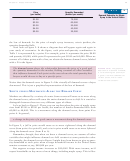 8
8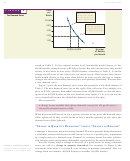 9
9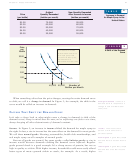 10
10 11
11 12
12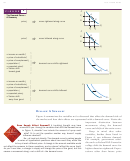 13
13 14
14 15
15 16
16 17
17 18
18 19
19 20
20 21
21 22
22 23
23 24
24 25
25 26
26 27
27 28
28 29
29 30
30 31
31 32
32 33
33 34
34 35
35 36
36 37
3786
Part I: Preliminaries
a. Graph the demand and supply curves.
d. What role did the demand side of the market play in
b. Find the equilibrium price and quantity.
explaining the rise and fall of gas prices?
c. Illustrate on your graph how a rise in the price of
12. Draw supply and demand diagrams for market A for each
automobiles would affect the gasoline market.
of the following. Then use your diagrams to illustrate the
8. How would each of the following affect the market for blue
impact of the following events. In each case, determine what
jeans in the United States? Illustrate each answer with a sup-
happens to price and quantity in each market.
ply and demand diagram.
a. A and B are substitutes, and the price of good B rises.
a. The price of denim cloth increases.
b. A and B satisfy the same kinds of desires, and there is a
b. An economic slowdown in the United States causes
shift in tastes away from A and toward B.
household incomes to decrease.
c. A is a normal good, and incomes in the community
increase.
9. Indicate which curve shifted—and in which direction—for
d. There is a technological advance in the production of
each of the following. Assume that only one curve shifts.
good A.
a. The price of furniture rises as the quantity bought and
e. B is an input used to produce good A, and the price of
sold falls.
B rises.
b. Apartment vacancy rates increase while average monthly
rent on apartments declines.
More Challenging
c. The price of personal computers continues to decline as
sales skyrocket.
13.
Suppose that demand is given by the equation
10. Consider the following forecast: “In 2008, we predict that
D
D
Q
500
50P, where Q
is quantity demanded, and P
the demand curve for solar panels will continue its shift
is the price of the good. Supply is described by the equation
rightward, which will tend to raise price and quantity.
S
S
Q
50
25P, where Q
is quantity supplied. What is the
However, with a higher price, supply will increase as well,
equilibrium price and quantity? (See Appendix.)
shifting the supply curve rightward. A rightward shift of the
14.
While crime rates have fallen across the country over the
supply curve will tend to lower price and raise quantity. We
past few years, they have fallen especially rapidly in
conclude that as 2008 proceeds, quantity will increase but
Manhattan. At the same time, there are some
the price of solar panels may either rise or fall.” There is a
neighborhoods in the New York metropolitan area in which
serious mistake of logic in this forecast. Can you find it?
the crime rate has remained constant. Using supply and
Explain.
demand diagrams for rental housing, explain how a falling
crime rate in Manhattan could make the residents in other
11. A couple of months after Hurricane Katrina, an article in
neighborhoods worse off. (Hint: As people from around the
The New York Times contained the following passage:
country move to Manhattan, what happens to rents there? If
“Gasoline prices—the national average is now $2.15,
people cannot afford to pay higher rent in Manhattan, what
according to the Energy Information Administration—have
might they do?)
fallen because higher prices held down demand and Gulf
15.
A Wall Street analyst observes the following equilibrium
Coast supplies have been slowly restored.”
The statement
3
price-quantity combinations in the market for restaurant
about supply is entirely correct and explains why gas prices
meals in a city over a four-year period:
came down. But the statement about demand confuses two
Q
concepts you learned about in this chapter.
(thousands of
a. What two concepts does the statement about demand
Year
P
meals per month)
seem to confuse? Explain briefly.
b. On a supply and demand diagram, show what most
1
$12
20
likely caused gasoline prices to rise when Hurricane
2
$15
30
Katrina shut down gasoline refineries on the Gulf Coast.
3
$17
40
c. On another supply and demand diagram, show what
4
$20
50
most likely happened in the market for gasoline as Gulf
She concludes that the market defies the law of demand. Is
Coast refineries were repaired—and began operating
she correct? Why or why not?
again—after the Hurricane.
3
“Economic Memo: Upbeat Signs Hold Cautions for the Future,” New
York Times, November 30, 2005.
ADVERTISEMENT
0 votes
Related Articles
Related forms


Related Categories
Parent category: Education