Supply And Demand - Chapter 3 Page 30
ADVERTISEMENT
 1
1 2
2 3
3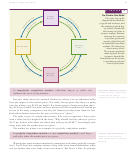 4
4 5
5 6
6 7
7 8
8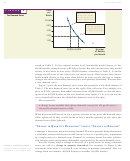 9
9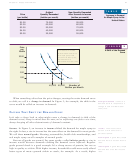 10
10 11
11 12
12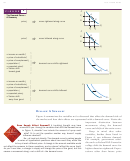 13
13 14
14 15
15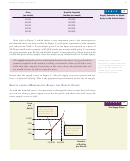 16
16 17
17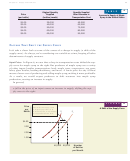 18
18 19
19 20
20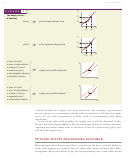 21
21 22
22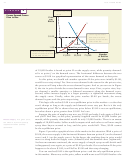 23
23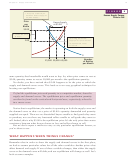 24
24 25
25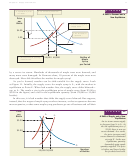 26
26 27
27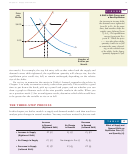 28
28 29
29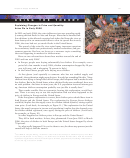 30
30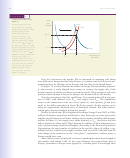 31
31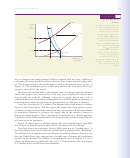 32
32 33
33 34
34 35
35 36
36 37
37Chapter 3: Supply and Demand
81
U S I N G
T H E
T H E O R Y
Explaining Changes in Price and Quantity:
Avian Flu in Early 2006
In 2005 and early 2006, the avian influenza virus was spreading rapid-
ly among chicken flocks in Asia and Europe. More than a hundred mil-
lion chickens in the affected countries had either died from the virus or
been destroyed in an unsuccessful effort to slow its spread. But in early
2006, the virus had not yet struck flocks in the United States.
The spread of the avian flu virus raised many important questions
for economists, health care professionals, medical researchers, and gov-
ernment agencies. But here we focus on a narrower topic: something
that was happening in markets for chicken meat.
Here are two relevant facts about these markets toward the end of
1
2005 and into early 2006.
•
In Europe, people were buying substantially less chicken. (For example, over a
period of a few months in early 2006, chicken consumption dropped by 20 per-
cent in France, and a whopping 70 percent in Italy.)
•
In the United States, people were buying more chicken.
At first glance (and especially to someone who has not studied supply and
demand), the explanation might seem obvious. It would go something like this: “Since
chickens were dying or being killed off in Europe, the Europeans had to make do with
less chicken. But in the United States, where chicken flocks were unaffected, there was
no such problem. And since in most years, the U.S. population rises and income goes
up, American chicken consumption probably rose just like it usually does.”
That sounds sensible. But an economist, hearing this explanation, would hesi-
tate. There is an easy way to test this explanation: find out what happened to the
price of chicken in Europe and the United States.
If the first-glance explanation is correct, then chicken prices should have risen in
both Europe and the United States. The explanation for Europe (fewer chickens
available) implies that the supply curve for chicken shifted leftward, raising equilib-
rium price. (Look back, for example, at Figure 11.) The explanation for the United
States (the usual increases in income and population) implies that the demand curve
for chicken shifted rightward, once again, raising the price of chicken. (Look back,
for example, at Figure 10).
So what happened to chicken prices in Europe and the United States?
They fell in both markets. In fact, they plummeted. From June 2005 to March
2006, the price of chicken in both Europe and the United States dropped by about
70 percent.
So, what really happened? As you’re about to see, the three-step process just dis-
cussed will help us find the answer.
Scott Kilman and Jane Zhang, “Avian-Flu Concerns Overseas Damp U.S. Chicken Exports,” The Wall
1
Street Journal, March 11–12, 2006, p. A5. Other data on chicken markets comes from the Food and
Agriculture Organization, “Poultry Trade Prospects for 2006 Jeopardized by Escalating AI Outbreaks,”
at , accessed on 3/16/06.
ADVERTISEMENT
0 votes
Related Articles
Related forms


Related Categories
Parent category: Education