Supply And Demand - Chapter 3 Page 34
ADVERTISEMENT
 1
1 2
2 3
3 4
4 5
5 6
6 7
7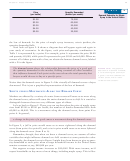 8
8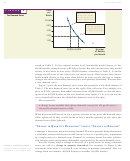 9
9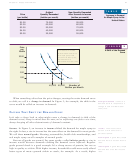 10
10 11
11 12
12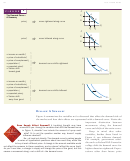 13
13 14
14 15
15 16
16 17
17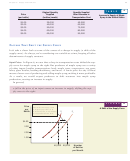 18
18 19
19 20
20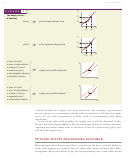 21
21 22
22 23
23 24
24 25
25 26
26 27
27 28
28 29
29 30
30 31
31 32
32 33
33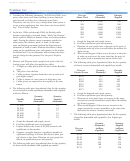 34
34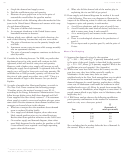 35
35 36
36 37
37Chapter 3: Supply and Demand
85
Problem Set
Answers to even-numbered Questions and Problems can be found on the text Web site at
1. Consider the following statement: “In 2005 and 2006, as at
Price per
Quantity
Quantity
many other times, new home building in most American
Alarm Clock
Demanded
Supplied
cities slowed, and the price of housing came down.
$ 5
3,500
700
Therefore, one way for a city to bring down home prices is
$10
3,000
900
to use zoning regulations that slow down new home build-
$15
2,500
1,100
ing.” True or false? Explain.
$20
2,000
1,300
$25
1,500
1,500
2. In the late 1990s and through 2000, the British public
$30
1,000
1,700
became increasingly concerned about “Mad Cow Disease,”
$35
500
1,900
which could be deadly to humans if they ate beef from these
cattle. Fearing the disease, many consumers switched to
a. Graph the demand and supply curves.
other meats, like chicken, pork, or lamb. At the same
b. Find the equilibrium price and quantity.
time, the British government ordered the destruction of
c. Illustrate on your graph how a decrease in the price of
thousands of head of cattle. Illustrate the effects of these
telephone wake-up services would affect the market for
events on the equilibrium price and quantity in the market
alarm clocks.
for British beef. Can we determine with certainty the direc-
d. What would happen if there was a decrease in the price
tion of change for the quantity? For the price? Explain
of wake-up services at the same time that the price of
briefly.
the plastic used to manufacture alarm clocks rose?
3. Discuss, and illustrate with a graph, how each of the fol-
6. The following table gives hypothetical data for the quantity
lowing events will affect the market for coffee:
of electric scooters demanded and supplied per month.
a. A blight on coffee plants kills off much of the Brazilian
crop.
Price per
Quantity
Quantity
b. The price of tea declines.
Electric Scooter
Demanded
Supplied
c. Coffee workers organize themselves into a union and
$150
500
250
gain higher wages.
$175
475
350
d. Coffee is shown to cause cancer in laboratory rats.
$200
450
450
e. Coffee prices are expected to rise rapidly in the near
$225
425
550
future.
$250
400
650
4. The following table gives hypothetical data for the quantity
$275
375
750
of two-bedroom rental apartments demanded and supplied
in Peoria, Illinois:
a. Graph the demand and supply curves.
b. Find the equilibrium price and quantity.
Quantity
Quantity
c. Illustrate on your graph how an increase in the wage
Monthly
Demanded
Supplied
rate paid to scooter assemblers would affect the market
Rent
(thousands)
(thousands)
for electric scooters.
$ 800
30
10
d. What would happen if there was an increase in the
$1,000
25
14
wage rate paid to scooter assemblers at the same time
$1,200
22
17
that tastes for electric scooters increased?
$1,400
19
19
7. The following table gives hypothetical data for the quantity
$1,600
17
21
of gasoline demanded and supplied in Los Angeles per
$1,800
15
22
month.
a. Graph the demand and supply curves.
Quantity
Quantity
b. Find the equilibrium price and quantity.
Demanded
Supplied
c. Explain briefly why a rent of $1,000 cannot be the
Price per
(millions
(millions
equilibrium in this market.
Gallon
of gallons)
of gallons)
d. Suppose a tornado destroys a significant number of
apartment buildings in Peoria, but doesn’t affect peo-
$1.20
170
80
ple’s desire to live there. Illustrate on your graph the
$1.30
156
105
effects on equilibrium price and quantity.
$1.40
140
140
$1.50
123
175
5. The following table gives hypothetical data for the quantity
$1.60
100
210
of alarm clocks demanded and supplied per month.
$1.70
95
238
ADVERTISEMENT
0 votes
Related Articles
Related forms


Related Categories
Parent category: Education