Supply And Demand - Chapter 3 Page 9
ADVERTISEMENT
 1
1 2
2 3
3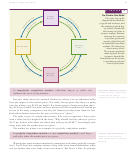 4
4 5
5 6
6 7
7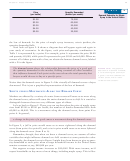 8
8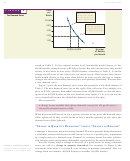 9
9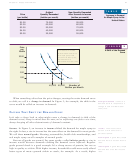 10
10 11
11 12
12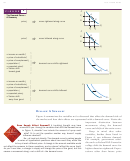 13
13 14
14 15
15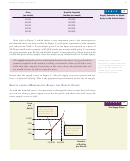 16
16 17
17 18
18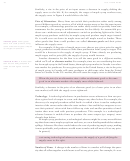 19
19 20
20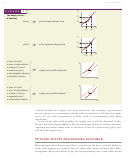 21
21 22
22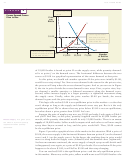 23
23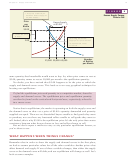 24
24 25
25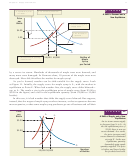 26
26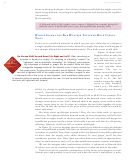 27
27 28
28 29
29 30
30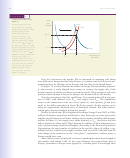 31
31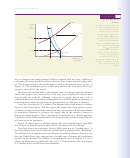 32
32 33
33 34
34 35
35 36
36 37
3760
Part I: Preliminaries
Price
2
F I G U R E
per
When the price
Bottle
The Demand Curve
is $4.00 per bottle,
40,000 bottles are
demanded (point A).
$5.00
A
4.00
At $2.00 per bottle,
60,000 bottles are
3.00
demanded (point B).
B
2.00
1.00
D
40,000 60,000
Number
of Bottles
per Month
trated in Table 2. At the original income level, households would choose to buy
60,000 bottles of maple syrup at $2.00 per bottle. But after income rises, they would
choose to buy more at that price—80,000 bottles, according to Table 2. A similar
change would occur at any other price for maple syrup: After income rises, house-
holds would choose to buy more than before. In other words, the rise in income
changes the entire relationship between price and quantity demanded. We now have
a new demand curve.
Figure 3 plots the new demand curve from the quantities in the third column of
Table 2. The new demand curve lies to the right of the old curve. For example, at a
price of $2.00, quantity demanded increases from 60,000 bottles on the old curve
(point B) to 80,000 bottles on the new demand curve (point C). As you can see, the
rise in household income has shifted the demand curve to the right.
More generally,
a change in any variable that affects demand—except for the good’s price—
causes the demand curve to shift.
When buyers would choose to buy a greater quantity at any price, the demand curve
shifts rightward. If they would decide to buy a smaller quantity at any price, the
demand curve shifts leftward.
“C
Q
D
”
“C
D
”
HANGE IN
UANTITY
EMANDED
VERSUS
HANGE IN
EMAND
Language is important when discussing demand. The term quantity demanded means
a particular amount that buyers would choose to buy at a specific price, represented
by a single point on a demand curve. Demand, by contrast, means the entire relation-
ship between price and quantity demanded, represented by the entire demand curve.
For this reason, when a change in the price of a good moves us along a demand
curve, we call it a change in quantity demanded. For example, in Figure 2, the
Change in quantity demanded
A
movement along a demand curve
movement from point A to point B is an increase in quantity demanded. This is a
in response to a change in price.
change from one number (40,000 bottles) to another (60,000 bottles).
ADVERTISEMENT
0 votes
Related Articles
Related forms


Related Categories
Parent category: Education