Supply And Demand - Chapter 3 Page 27
ADVERTISEMENT
 1
1 2
2 3
3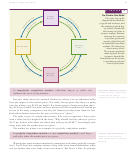 4
4 5
5 6
6 7
7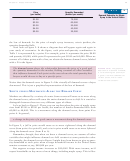 8
8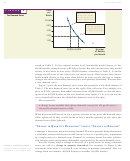 9
9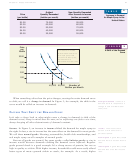 10
10 11
11 12
12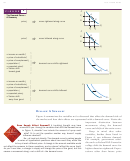 13
13 14
14 15
15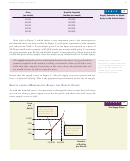 16
16 17
17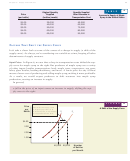 18
18 19
19 20
20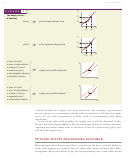 21
21 22
22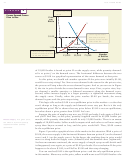 23
23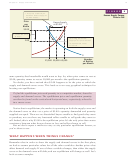 24
24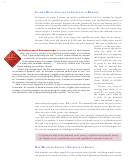 25
25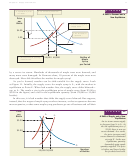 26
26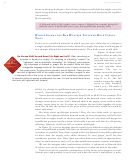 27
27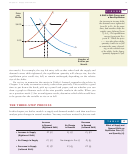 28
28 29
29 30
30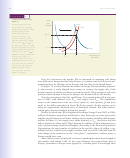 31
31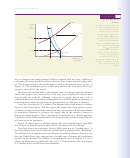 32
32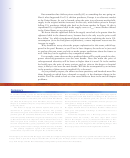 33
33 34
34 35
35 36
36 37
3778
Part I: Preliminaries
farms to housing developers. Any of these changes would shift the supply curve for
maple syrup leftward, increasing the equilibrium price and decreasing the equilibri-
um quantity.
More generally,
A leftward shift of the supply curve causes a leftward movement along the
demand curve. Equilibrium price rises, but equilibrium quantity falls.
H
I
B
W
T
: B
C
IGHER
NCOME AND
AD
EATHER
OGETHER
OTH
URVES
S
HIFT
So far, we’ve considered examples in which just one curve shifts due to a change in
a single variable that influences either demand or supply. But what would happen if
two changes affected the market simultaneously? Then both curves would shift.
Figure 12 shows what
happens when we take the
Do Curves Shift Up and Down? Or Right and Left?
When describing an
two factors we’ve just
increase in demand or supply, it’s tempting to substitute “upward” for
explored separately (a rise
“rightward,” and to substitute “downward” for “leftward” when describ-
in income and bad weath-
DANGEROUS
ing a decrease in demand or supply. But be careful! While this inter-
CURVES
er) and combine them
changeable language works for the demand curve, it does not work for
together.
The
rise
in
the supply curve. To prove this to yourself, look at Figure 6. There you can
income causes the demand
see that a rightward shift of the supply curve (an increase in supply) is also
curve to shift rightward,
a downward shift of the curve. In later chapters, it will sometimes make sense
from D
to D
. The bad
to describe shifts as upward or downward. For now, it’s best to avoid these terms
1
2
and stick with rightward and leftward .
weather causes the supply
curve to shift leftward,
from S
to S
. The result of
1
2
all this is a change in equilibrium from point E to point E', where the new demand
curve D
intersects the new supply curve S
.
2
2
Notice that the equilibrium price rises from $3.00 to $6.00 in our example. This
should come as no surprise. A rightward shift in the demand curve, with no other
change, causes price to rise. And a leftward shift in the supply curve, with no other
change, causes price to rise. So when we combine the two shifts together, the price
must rise. In fact, the increase in the price will be greater than would be caused by
either shift alone.
But what about equilibrium quantity? Here, the two shifts work in opposite
directions. The rightward shift in demand works to increase quantity, while the left-
ward shift in supply works to decrease quantity. We can’t say what will happen to
equilibrium quantity until we know which shift is greater and thus has the greater
influence. Quantity could rise, fall, or remain unchanged.
In Figure 12, it just so happens that the supply curve shifts more than the demand
curve, so equilibrium quantity falls. But you can easily prove to yourself that the other
outcomes are possible. First, draw a graph where the demand curves shifts rightward
by more than the supply curve shifts leftward. In your graph, you’ll see that
equilibrium quantity rises. Then, draw one where both curves shift (in opposite direc-
tions) by equal amounts, and you’ll see that equilibrium quantity remains unchanged.
We can also imagine other combinations of shifts. A rightward or leftward shift
in either curve can be combined with a rightward or leftward shift in the other.
Table 6 lists all the possible combinations. It also shows what happens to equi-
librium price and quantity in each case, and when the result is ambiguous (a ques-
ADVERTISEMENT
0 votes
Related Articles
Related forms


Related Categories
Parent category: Education