Unit 1: Cost-Volume-Profit Analysis Economics Worksheet With Answers - Cma311s Notes, 2010 Page 12
ADVERTISEMENT
 1
1 2
2 3
3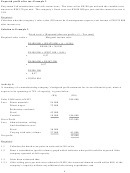 4
4 5
5 6
6 7
7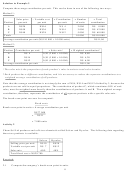 8
8 9
9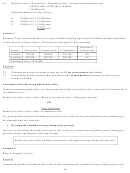 10
10 11
11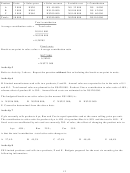 12
12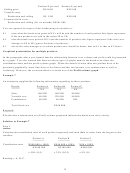 13
13 14
14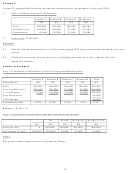 15
15 16
16 17
17 18
18 19
19 20
20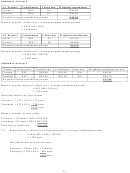 21
21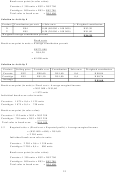 22
22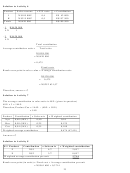 23
23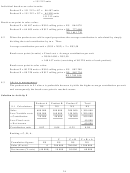 24
24 25
25 26
26 27
27Product
Units
x Sales price
= Sales revenue
– Variable cost
= Contribution
A
2 000
N$20
N$ 40 000
N$ 32 000
N$ 8 000
B
3 000
N$50
N$150 000
N$108 000
N$ 42 000
C
5 000
N$40
N$200 000
N$140 000
N$ 60 000
Totals
10 000
N$390 000
N$280 000
N$110 000
Total contribution
Average contribution ratio =
Total sales
N$110 000
= N$390 000
= 0,28205
Fixed costs
Break-even point in sales value = Average contribution ratio
N$77 000
= 0,28205
= N$273 000
Activity 5
Refer to Activity 3 above. Repeat the question without first calculating the break-even point in units.
Activity 6
H Limited manufactures and sells two products, J and K. Annual sales are expected to be in the ratio of J:1
and K:3. Total annual sales are planned to be N$420 000. Product J has a contribution to sales ratio of 40%,
whereas that of product K is 50%. Annual fixed costs are estimated to be N$120 000.
The budgeted break-even sales value (to the nearest N$1 000) is:
A N$196 000;
B N$200 000;
C N$253 000;
D N$255 000
E Cannot be determined from the above data.
Activity 7
Z plc currently sells products Aye, Bee and Cee in equal quantities and at the same selling price per unit.
The contribution to sales ratio for product Aye is 40%; for product Bee it is 50% and the total is 48%. If
fixed costs are unaffected by mix and are currently 20% of sales, the effect of changing the product mix to:
Aye
40%;
Bee
25%;
Cee
35%
is that the total contribution : total sales ratio changes to:
A 27,4%
B 45,3%
C 47,4%
D 48,4%
E 68,4%
Activity 8
PE Limited produces and sells two products, P and E. Budgets prepared for the next six months give the
following information:
12
ADVERTISEMENT
0 votes
Related Articles
Related forms


Related Categories
Parent category: Education