Unit 1: Cost-Volume-Profit Analysis Economics Worksheet With Answers - Cma311s Notes, 2010 Page 15
ADVERTISEMENT
 1
1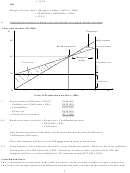 2
2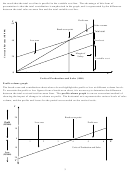 3
3 4
4 5
5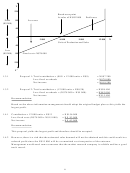 6
6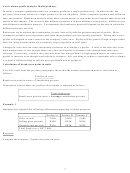 7
7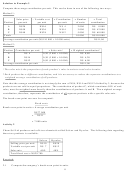 8
8 9
9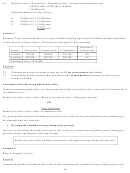 10
10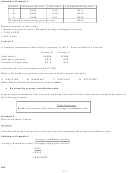 11
11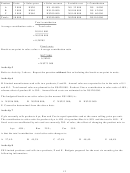 12
12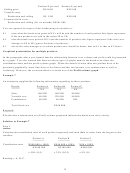 13
13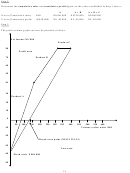 14
14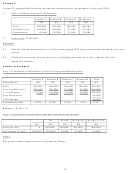 15
15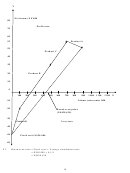 16
16 17
17 18
18 19
19 20
20 21
21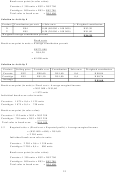 22
22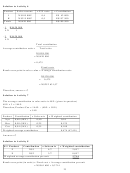 23
23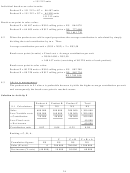 24
24 25
25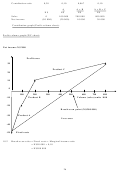 26
26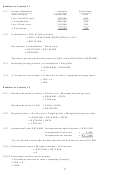 27
27Example 8
Nerina CC supplied the following information regarding their four products for the year 2005:
1.
Sales, Variable costs and Contributions:
Product A
Product B
Product C
Product D
N$
N$
N$
N$
Sales
200 000
400 000
200 000
100 000
Variable costs
205 000
350 000
175 000
70 000
Contribution
(5 000)
50 000
25 000
30 000
2.
Fixed costs: N$50 000
Required:
8.1
Plot the relevant information on a Profit-volume graph (P/V chart) and indicate the break-even sales
clearly.
8.2
Check the correctness of your answer by calculating the break-even sales with the aid of an
applicable formula.
Solution to Example 8
Step 1: Calculation of individual as well as average contribution ratios:
Product A
Product B
Product C
Product D
Total
Calculations
N$
N$
N$
N$
N$
Sales
200 000
400 000
200 000
100 000
900 000
Less Variable costs
205 000
350 000
175 000
70 000
800 000
= Contribution
(5 000)
50 000
25 000
30 000
100 000
Less Fixed costs
50 000
= Net income
50 000
Contribution ratio
- 0,025
0,125
0,125
0,30
0,111
Ranking = D, B, C, A.
Step 2: Calculation of cumulative sales and cumulative net income:
D
D + B
D + B + C
D + B + C + A
N$
N$
N$
N$
N$
Sales (X-axis)
0
100 000
500 000
700 000
900 000
Net income (Y-axis)
(50 000)
(20 000)
30 000
55 000
50 000
Step 3:
The profit-volume graph can now be plotted as follows:
15
ADVERTISEMENT
0 votes
Related Articles
Related forms


Related Categories
Parent category: Education