Unit 1: Cost-Volume-Profit Analysis Economics Worksheet With Answers - Cma311s Notes, 2010 Page 24
ADVERTISEMENT
 1
1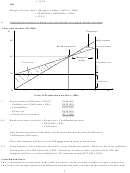 2
2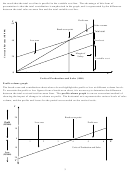 3
3 4
4 5
5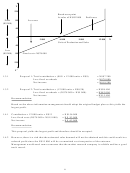 6
6 7
7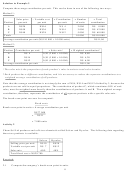 8
8 9
9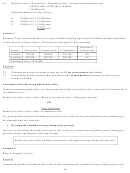 10
10 11
11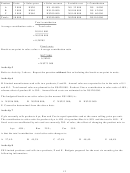 12
12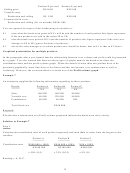 13
13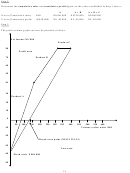 14
14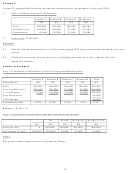 15
15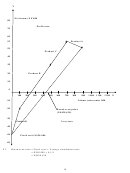 16
16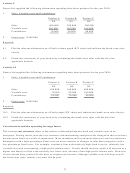 17
17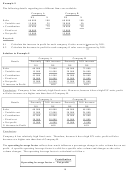 18
18 19
19 20
20 21
21 22
22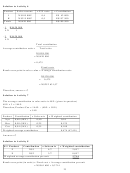 23
23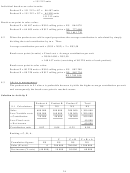 24
24 25
25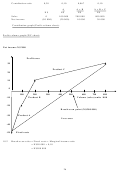 26
26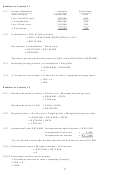 27
27= 151 212 units
Individual break-even sales in units:
Product P = 151 212 x 4/7 = 86 407 units
Product E = 151 212 x 3/7 = 64 805 units
151 212 units
Break-even point in sales value:
Product P = 86 407 units x N$10 selling price = N$ 864 070
Product E = 64 805 units x N$12 selling price = N$ 777 660
N$ 1 641 730
8.2
When the products are sold in equal proportions the average contribution is calculated by simply
dividing the total contribution by two. Thus:
Average contribution per unit = (N$5 + N$2) ÷ 2 = N$3,50
Break-even point (in units) = Fixed cost ÷ Average contribution per unit
= N$561 600 ÷ N$3,50
= 160 457 units (consisting of 80 228 units of each product).
Break-even point in sales value:
Product P = 80 228 units x N$10 selling price = N$ 802 280
Product E = 80 228 units x N$12 selling price = N$ 962 736
N$ 1 765 016
8.3
Advice to management:
The product mix in 9.1 above is preferable because it yields the higher average contribution per unit
and consequently the break-even point is reached sooner.
Solution to Activity 9
Product A
Product B
Product C
Total
9.1 Calculations
N$
N$
N$
N$
Sales
600 000
500 000
200 000
1 300 000
Less Variable costs
590 000
160 000
150 000
1 200 000
= Contribution
10 000
40 000
50 000
100 000
Less Fixed costs
40 000
= Net income
60 000
Contribution ratio
0,02
0,08
0,25
0,08
Ranking = C, B, A.
C
C + B
C + B + A
Cumulative figures
N$
N$
N$
N$
Sales (X-axis)
0
200 000
700 000
1 300 000
Net income (Y-axis)
(40 000)
10 000
50 000
60 000
24
ADVERTISEMENT
0 votes
Related Articles
Related forms


Related Categories
Parent category: Education