Unit 1: Cost-Volume-Profit Analysis Economics Worksheet With Answers - Cma311s Notes, 2010 Page 25
ADVERTISEMENT
 1
1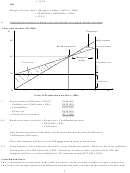 2
2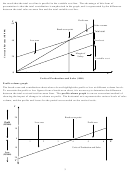 3
3 4
4 5
5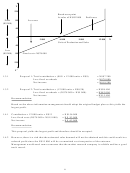 6
6 7
7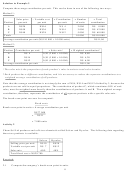 8
8 9
9 10
10 11
11 12
12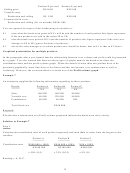 13
13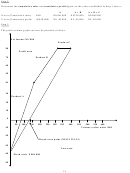 14
14 15
15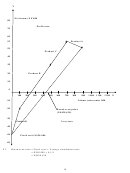 16
16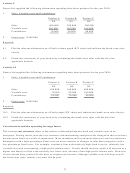 17
17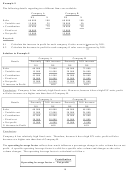 18
18 19
19 20
20 21
21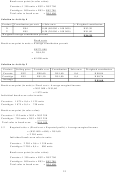 22
22 23
23 24
24 25
25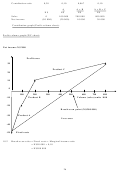 26
26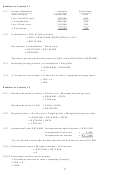 27
27Profit-volume graph (P/V chart)
Net income N$’000
70
Profit area
60
Product A
50
40
Product B
30
20
10
C
Product
0
100
200
300
400
500
600
700
800
900
1 000 1 100 1 200 1 300
-10
Volume (sales) units ‘000
-20
Break-even point (N$500 000)
-30
Loss area
-40
Fixed costs
9.2
Break-even sales = Fixed costs ÷ Contribution ratio
= N$40 000 ÷ 0,08
= N$500 000
Solution to Activity 10
10.1
Calculations:
Product A
Product B
Product C
Total
N$
N$
N$
N$
Sales
100 000
100 000
600 000
800 000
Variable costs
70 000
90 000
560 000
720 000
Contribution
30 000
10 000
40 000
80 000
Fixed costs
50 000
Net income
30 000
25
ADVERTISEMENT
0 votes
Related Articles
Related forms


Related Categories
Parent category: Education