Unit 1: Cost-Volume-Profit Analysis Economics Worksheet With Answers - Cma311s Notes, 2010 Page 3
ADVERTISEMENT
 1
1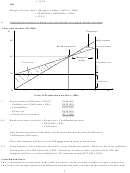 2
2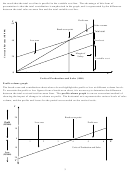 3
3 4
4 5
5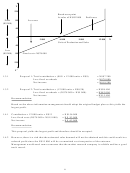 6
6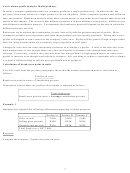 7
7 8
8 9
9 10
10 11
11 12
12 13
13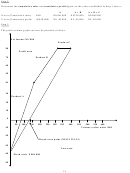 14
14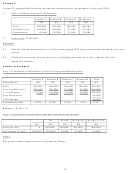 15
15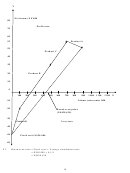 16
16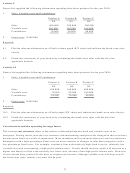 17
17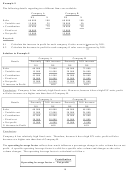 18
18 19
19 20
20 21
21 22
22 23
23 24
24 25
25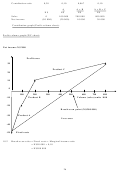 26
26 27
27the result that the total cost line is parallel to the variable cost line. The advantage of this form of
presentation is that the total contribution is emphasised in the graph, and is represented by the difference
between the total sales revenue line and the total variable cost line.
Profit area
Y
60
Sales revenue
Break-even point
Total cost
40
Loss area
Fixed cost
Margin of
20
Safety
Variable cost
0
1
2
3
4
5
6
X
Units of Production and Sales (‘000)
Profit-volume graph
The break-even and contribution charts above do not highlight the profit or loss at different volume levels.
To ascertain the profit or loss figures from a break-even chart, it is necessary to determine the difference
between the total-cost and total-revenue lines. The profit-volume graph is a more convenient method of
showing the impact of changes in volume on profit. The horisontal axis represents the various levels of sales
volume, and the profits and losses for the period are recorded on the vertical scale.
Y
20
Break-even point
Profit
Loss area
Profit area
(N$’000)
10
0
1
2
3
4
5
6
X
10
Units of Production and Sales
Loss
(N$’000)
20
1
Y
3
ADVERTISEMENT
0 votes
Related Articles
Related forms


Related Categories
Parent category: Education