Unit 1: Cost-Volume-Profit Analysis Economics Worksheet With Answers - Cma311s Notes, 2010 Page 2
ADVERTISEMENT
 1
1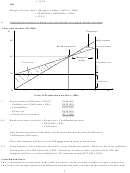 2
2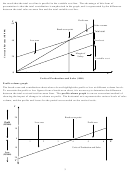 3
3 4
4 5
5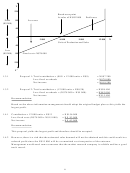 6
6 7
7 8
8 9
9 10
10 11
11 12
12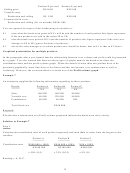 13
13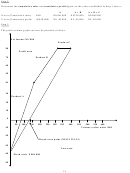 14
14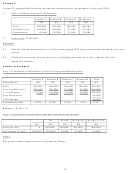 15
15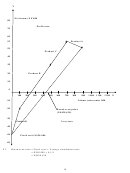 16
16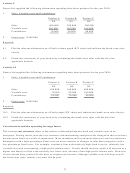 17
17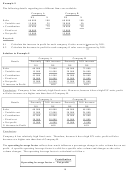 18
18 19
19 20
20 21
21 22
22 23
23 24
24 25
25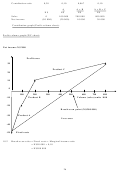 26
26 27
27= 33,3%
OR
Margin of safety ratio = (Margin of safety ÷ Sales) x 100%
= (N$20 000 ÷ N$60 000) x 100%
= 33,3%
6.
Graphical presentation of break-even point (break-even graph, break-even chart):
Costs and revenue (N$’000)
Profit area
Y
60
Sales revenue
Break-even point
T
otal cost line
40
Margin of
Safety
Loss area
Variable cost
20
Fixed cost
1
2
3
4
5
6
0
X
Units of Production and Sales (‘000)
7.
Sales revenue (5 000 units x N$10)
N$50 000
– Variable cost (5 000 units x N$5)
N$25 000
= Contribution
N$25 000
– Fixed cost
N$20 000
= Net profit (net income)
N$ 5 000
8.1
Break-even sales (in units) = Fixed cost ÷ Contribution per unit
= N$18 000 ÷ N$4
= 4 500 units
New break-even point (4 500 units) less Previous break-even point (4 000 units)
= Difference (500 units)
Thus: the company will have to sell 500 more units in order to break even.
8.2
If the company sells 4 500 units, the profit is zero (break-even point). However, for every additional
unit in excess of 4 500, the profit is N$4. Therefore, in order to show a profit of N$7 500, the
company will have to sell an additional 1 875 units per month (N$7 500 ÷ N$4).
Contribution chart
This is an alternative presentation of the break-even point. In this case the variable cost line is drawn first.
The fixed costs are represented by the difference between the total cost line and the variable cost line, with
2
ADVERTISEMENT
0 votes
Related Articles
Related forms


Related Categories
Parent category: Education