Probability And Statistics Worksheets Page 2
ADVERTISEMENT
 1
1 2
2 3
3 4
4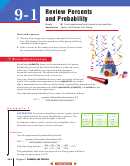 5
5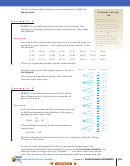 6
6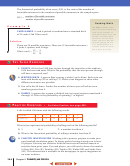 7
7 8
8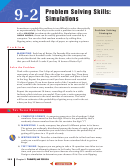 9
9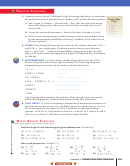 10
10 11
11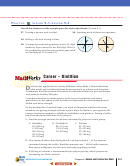 12
12 13
13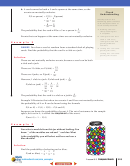 14
14 15
15 16
16 17
17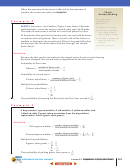 18
18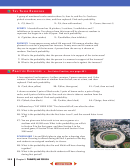 19
19 20
20 21
21 22
22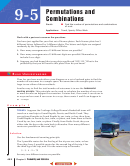 23
23 24
24 25
25 26
26 27
27 28
28 29
29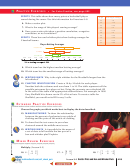 30
30 31
31 32
32 33
33 34
34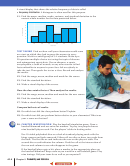 35
35 36
36 37
37 38
38 39
39 40
40 41
41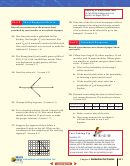 42
42Home Run Greats–Then and Now
Player
Year
Home
Games
At bats
Batting
Runs
runs
played
average batted in
Jim Thome
2003
47
159
578
.266
131
Barry Bonds
2001
73
153
476
.328
137
Alex Rodriguez
2002
57
162
624
.300
142
Roger Maris
1961
61
161
590
.269
142
Babe Ruth
1927
60
151
540
.356
164
Home Runs Month by Month
Player
Year
Apr
May
Jun
Jul
Aug
Sept
Oct
Jim Thome
2003
4
8
9
6
10
10
0
Barry Bonds
2001
11
17
11
6
12
12
4
Alex Rodriguez
2002
9
8
7
12
12
9
0
Roger Maris
1961
1
11
15
13
11
9
1
Babe Ruth
1927
4
12
9
9
9
17
0
Data Activity: Home Run Greats
Use the tables for Questions 1–4.
1. For each player, divide the at bats by the total of home runs and
round to the nearest hundredth. Compare the unit rates. Which
player had the best unit rate?
2. What percent of Barry Bond’s home runs were hit in August and
September?
3. Find the average number of at bats per game for each
player. Round to the nearest hundredth. Which player
had the greatest average?
4. In 2001, Bonds hit 49 singles. For what percent of
his at bats did he reach first base by hitting a single?
C
I
HAPTER
NVESTIGATION
Baseball has been called “America’s Pastime.” In recent
years, the game’s appeal has become international. Using
statistics and probability, fans at home can predict what
will happen when the bases are loaded in the bottom of
the ninth inning.
Working Together
Gather baseball statistics and design your baseball simulation game
using dice and percentile cards. Make a lineup and play a game.
Decide whether the game’s outcome matches your predictions. Use
the Chapter Investigation icons to guide your group.
381
Chapter 9 Probability and Statistics
ADVERTISEMENT
0 votes
Related Articles
Related forms


Related Categories
Parent category: Education