Probability And Statistics Worksheets Page 30
ADVERTISEMENT
 1
1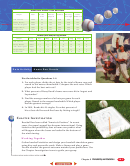 2
2 3
3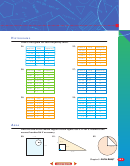 4
4 5
5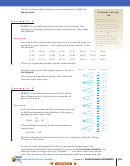 6
6 7
7 8
8 9
9 10
10 11
11 12
12 13
13 14
14 15
15 16
16 17
17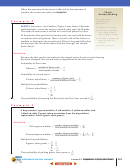 18
18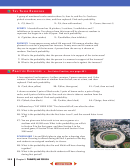 19
19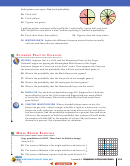 20
20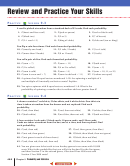 21
21 22
22 23
23 24
24 25
25 26
26 27
27 28
28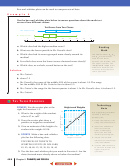 29
29 30
30 31
31 32
32 33
33 34
34 35
35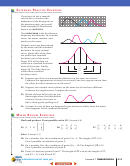 36
36 37
37 38
38 39
39 40
40 41
41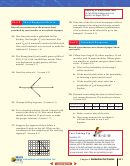 42
42P
E
RACTICE
XERCISES • For Extra Practice, see page 692.
SPORTS
This table shows how many points a basketball player
Age
Scoring Average
scored during his career. Use this information for Exercises 6–8.
23
18
24
17.5
6. Make a scatter plot.
25
22.5
7. What is the range of this player’s scoring average?
26
24
27
21.5
8. Does your scatter plot show a positive correlation, a negative
28
26
correlation, or no correlation?
29
23.5
SPORTS
These box-and-whisker plots show batting averages for
30
22.5
3 baseball teams.
31
27.5
32
20.5
Player Batting Averages
Artichokes
Onions
Meatballs
200
210
220
230
240
250
260
270
280
290
300
9. Which team has the highest median batting average?
10. Which team has the smallest range of batting averages?
11.
WRITING MATH
Why is the right whisker for the Meatballs longer than the
left whisker?
12.
CHAPTER INVESTIGATION
Create a 10-by-10 table for each player.
Number both the columns and rows from 1 to 10. The table represents all the
possible outcomes for a player at bat. Using the percents you calculated, fill
in the cells of the table with appropriate abbreviations. For example, in 1998
Gary Sheffield hit a home run in 5% of his at bats. To create a table for
Sheffield, you would write HR in any 5 cells.
E
P
E
XTENDED
RACTICE
XERCISES
Choose the graph you think works best to display the data described.
MANUFACTURING
13.
To show the relationship
between the percent of polyester in an article of
clothing and the price of the article of clothing
14. To show that the test scores in your class
clustered around the middle-most score
15.
WRITING MATH
Is it possible for the mean of
a set of data to fall outside the box part of a
box-and-whisker plot? Explain.
M
R
E
IXED
EVIEW
XERCISES
Multiply. (Lesson 8-5)
3
5
6
3
9
8
7
16. 6
17. 4
18. 7
4
2
7
1
4
6
0
409
Lesson 9-6 Scatter Plots and Box-and-Whisker Plots
ADVERTISEMENT
0 votes
Related Articles
Related forms


Related Categories
Parent category: Education