Probability And Statistics Worksheets Page 35
ADVERTISEMENT
 1
1 2
2 3
3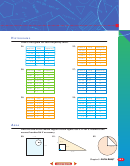 4
4 5
5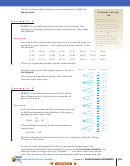 6
6 7
7 8
8 9
9 10
10 11
11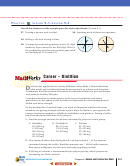 12
12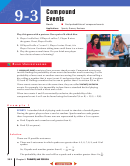 13
13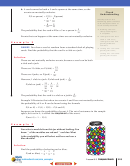 14
14 15
15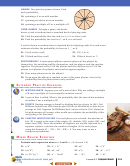 16
16 17
17 18
18 19
19 20
20 21
21 22
22 23
23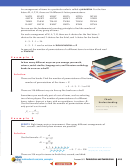 24
24 25
25 26
26 27
27 28
28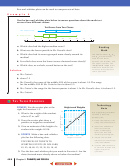 29
29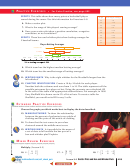 30
30 31
31 32
32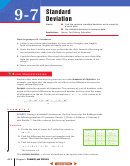 33
33 34
34 35
35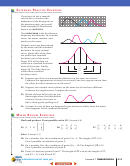 36
36 37
37 38
38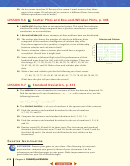 39
39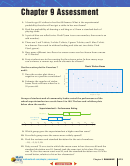 40
40 41
41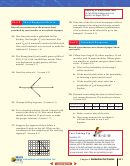 42
42A visual display that shows the relative frequency of data is called
a frequency distribution. A histogram is often used for this purpose.
11. Find the mean, median, mode, variance, and standard deviation to the
nearest whole number for the data presented below.
7
6
5
4
3
2
1
10
20
30
40
50
60
Scores
TEST TAKING
Find out how well your classmates would score
on a test on which they had to guess the answer to every
question. Work in a small group of 3–4 students. Make up a
20-question multiple-choice test using the topic of obscure
and unimportant sports data. Use an almanac, a sports
encyclopedia, a book of records, or any other source to find
facts unfamiliar to anyone in your class. Ask everybody to
take the test. Then grade the test as a class. Record and analyze
the results.
12. Find the range, mean, median and mode for the scores.
13. Find the standard deviation.
14. Make a visual display of the scores.
Have the class retake the test. Then analyze the results.
15. Find the range, mean, median and mode for the new scores.
16. Find the standard deviation.
17. Make a visual display of the scores.
Compare both sets of results.
18. On which test did the class perform better? Explain.
19. On which test did you perform better relative to your classmates? What was
your z-score on that test?
CHAPTER INVESTIGATION
20.
Play the baseball simulation game. Draw a
baseball diamond and use coins for markers. To play, two people choose
nine baseball players each. Put the players’ tables in batting order.
Use 10-sided polyhedral dice or a deck of standard playing cards with the
kings, queens and jacks removed. Either roll two dice or draw two cards from
the deck. The first die or card indicates the row on the player’s table. The
second die or card indicates the column. Find the cell at the intersection of
the row and column to see what happens in the game.
If the baseball player gets a hit, place a marker in the appropriate place on
the baseball diamond. Keep score as you would in a real baseball game. Play
nine innings. Did your team do as well as you expected?
414
Chapter 9 Probability and Statistics
ADVERTISEMENT
0 votes
Related Articles
Related forms


Related Categories
Parent category: Education