Probability And Statistics Worksheets Page 36
ADVERTISEMENT
 1
1 2
2 3
3 4
4 5
5 6
6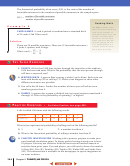 7
7 8
8 9
9 10
10 11
11 12
12 13
13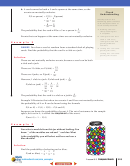 14
14 15
15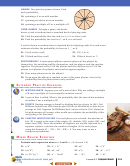 16
16 17
17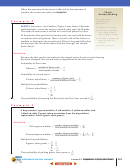 18
18 19
19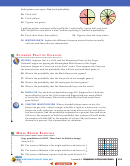 20
20 21
21 22
22 23
23 24
24 25
25 26
26 27
27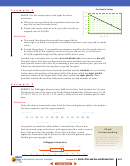 28
28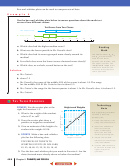 29
29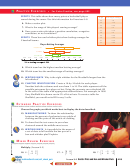 30
30 31
31 32
32 33
33 34
34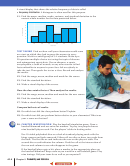 35
35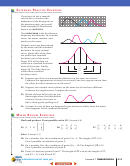 36
36 37
37 38
38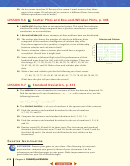 39
39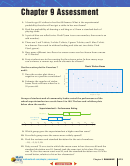 40
40 41
41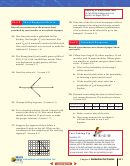 42
42E
P
E
XTENDED
RACTICE
XERCISES
If you were to use a smooth
curved line to connect the
midpoints of the histogram on
the previous page, you would
form a frequency distribution
known as a bell curve.
The normal curve is the best known
frequency distribution. In a normal
curve, the mean, median, and
mode are the same.
Normal curves are determined
by the mean and the standard
deviation. In every normal
curve, about 68% of the data
are within one standard
deviation unit of the mean.
About 95% of the data are
within two standard deviation
3
2
1
0
1
2
3
units of the mean. Finally,
mean
about 99.7% of the data are
68%
95%
within three standard
99.7%
deviation units.
21. Suppose you drew two normal distributions on the same set of axes.
Compare the appearances of these two curves if one has a greater mean than
the other, but their variances are the same?
22. Suppose two normal curves drawn on the same set of axes have different
variances but equal means. Compare the curves.
23. Which of these bell curves do you
think might show the distribution
of scores if your class were to
take a third-grade spelling test?
24. As items in a set of data are dispersed more and more widely from the mean,
what happens to the standard deviation?
M
R
E
IXED
EVIEW
XERCISES
Find each product. If not possible, write NP. (Lesson 8-6)
1
2
0
3
2
5
4
0
5
6
25. [3 2 4]
6
26.
27.
1
5
8
4
3
1
2
8
4
5
Solve. (Lesson 3-1)
28. On a number line, the coordinate of point F is
4. The length of F G is 13.
Give 2 possible coordinates of point G.
29. On a number line, the coordinate of point Q is
18. The length of Q R is 76.
Give 2 possible coordinates of point R.
30. Point S is between points R and T. The length of R S is twice the length of S T ,
and RT
57. Find RS and ST.
415
Lesson 9-7 Standard Deviation
ADVERTISEMENT
0 votes
Related Articles
Related forms


Related Categories
Parent category: Education