Probability And Statistics Worksheets Page 29
ADVERTISEMENT
 1
1 2
2 3
3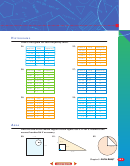 4
4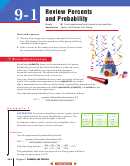 5
5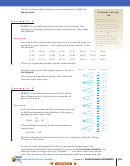 6
6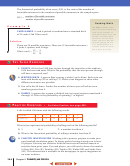 7
7 8
8 9
9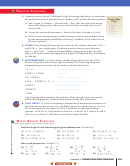 10
10 11
11 12
12 13
13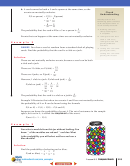 14
14 15
15 16
16 17
17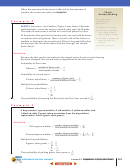 18
18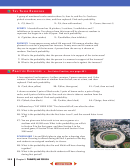 19
19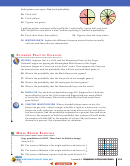 20
20 21
21 22
22 23
23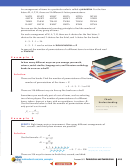 24
24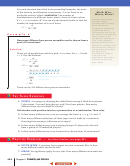 25
25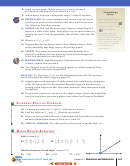 26
26 27
27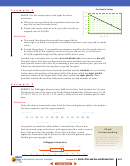 28
28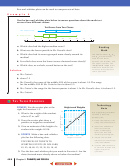 29
29 30
30 31
31 32
32 33
33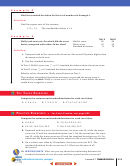 34
34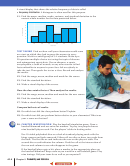 35
35 36
36 37
37 38
38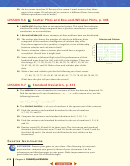 39
39 40
40 41
41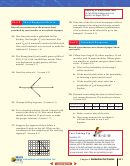 42
42Box-and-whisker plots can be used to compare sets of data.
E x a m p l e 4
Use the box-and-whisker plots below to answer questions about the math test
scores of two different classes.
Test Scores From Two Classes
Ms. Cotter’s Class
Mr. Pascal’s Class
5
6
7
8
9
10
11
12
13
14
a. Which class had the higher median score?
Reading
Math
b. What was the lower quartile in Mr. Pascal’s class?
c. Which class had its scores grouped more closely around its
The abbreviations Q
, Q
,
1
2
and Q
are sometimes
median?
3
used for the lower
d. For which class were the lowest scores clustered more closely?
quartile, the median, and
the upper quartile. The
e. Which class, as a whole, scored better on the test?
interquartile range is the
difference between the
values of the upper and
Solution
lower quartiles.
a. Ms. Cotter’s
b. about 7.2
c. Mr. Pascal’s; the range of the middle 50% of the scores is about 1.8. The range
for the middle 50% in Ms. Cotter’s class is about 3.5.
d. Ms. Cotter’s; the range for the lowest quarter is about 1. In Mr. Pascal’s class, it is about 1.2.
e. Ms. Cotter’s
T
T
E
RY
HESE
XERCISES
Technology
FITNESS
Use the scatter plot at the
Heights and Weights
Note
right for Exercises 1–3.
75
Use a graphing calculator
1. What is the weight of the student
to make a box-and-
who is 67 in. tall?
whisker plot.
70
2. Does the scatter plot show a
1. Enter the data as a list
positive or negative correlation?
using the STAT feature.
65
2. Select the STATPLOT
3. Give an estimate of the height of a
menu and choose
student who weighs 145 lb.
Plot1. Under Type,
60
select the box-and-
4.
SPORTS
Make a box-and-whisker
whisker plot diagram.
120
140
160
180
plot for the following data.
Weight in Pounds
3. Adjust the window
dimensions if necessary
TOP PRICES OF TICKETS TO
and press GRAPH.
SPORTING EVENTS (IN DOLLARS)
4. Use the TRACE feature
45, 55, 40, 60, 15, 25, 35, 30, 10, 40
to find the median and
upper and lower
5. Use the box-and-whisker plot you made in Exercise 4. Are the
quartiles.
data clustered more closely above or below the median?
408
Chapter 9 Probability and Statistics
ADVERTISEMENT
0 votes
Related Articles
Related forms


Related Categories
Parent category: Education