Probability And Statistics Worksheets Page 39
ADVERTISEMENT
 1
1 2
2 3
3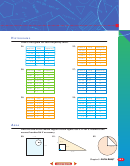 4
4 5
5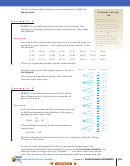 6
6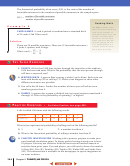 7
7 8
8 9
9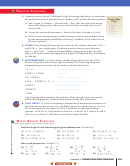 10
10 11
11 12
12 13
13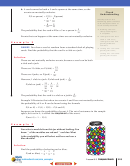 14
14 15
15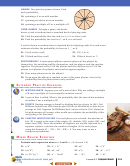 16
16 17
17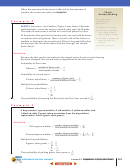 18
18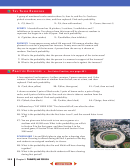 19
19 20
20 21
21 22
22 23
23 24
24 25
25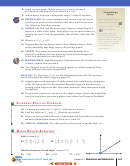 26
26 27
27 28
28 29
29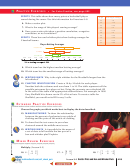 30
30 31
31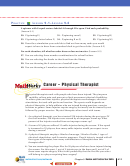 32
32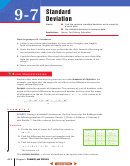 33
33 34
34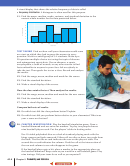 35
35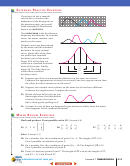 36
36 37
37 38
38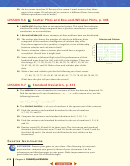 39
39 40
40 41
41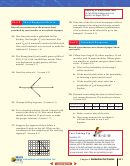 42
4232. An ice cream store has 31 flavors of ice cream. Lamel wants to buy three
pints of ice cream. If each pint of ice cream is a different flavor, how many
different purchases can he make?
LESSON 9-6
Scatter Plots and Box-and-Whisker Plots, p. 406
A scatter plot displays data as unconnected points. The trend line indicates
whether the items being compared have a positive correlation, a negative
correlation, or no correlation.
A box-and-whisker plot shows extremes of data and how data are distributed.
33. The scatter plot shows the number of calories in different fruits
Calories and Calcium
compared to the number of milligrams of calcium they offer.
y
Does there appear to be a positive, a negative, or no relationship
60
between calories and calcium in fruit?
50
40
34. Name a situation where a scatter plot would have a negative
30
correlation. Sketch how it might look.
20
35. Some students at Johnson High rated the performance of their
10
x
basketball team from 0 to 100, with 100 as the highest. These are
0
100
200
300
the ratings: 67, 71, 58, 53, 65, 73, 64, 50, 52, 74, 48, 47, 53, 82, 63,
Calories
59, 67, 85, 45, 43, and 56. Make a box-and-whisker plot of this
data.
36. Make a box-and-whisker plot for the following set of test scores.
77, 80, 75, 73, 77, 81, 62, 87, 99, 85, 82, 81, 77, 72, 78, 83, 86, 79, 80, 78
What does the plot tell you about the scores?
LESSON 9-7
Standard Deviation, p. 412
The variance of a set of numbers is a measure of how the data are dispersed. To
find the variance of a set of numbers x
, x
, . . . x
, with a mean of m, use the
1
2
n
following formula.
2
2
2
(x
m)
(x
m)
(x
m)
1
2
n
n
The standard deviation, s, of a set of numbers is the square root of the variance.
37. Find the variance and standard deviation for the set of numbers
4, 7, 10, 13, and 16.
38. Compute the variance and standard deviation for 3, 5, 10, 7, 5.
39. Find the variance and standard deviation for the set of numbers 5, 2, 6, 8,
and 19.
40. Kendra scored 95, 90 and 95 on three tests. The class mean and standard
deviation for the first test were 75 and 10; for the second, 75 and 5; and for
the third, 80 and 6. On which test did Kendra do best relative to her
classmates?
C
I
HAPTER
NVESTIGATION
EXTENSION
Present your game to your class. After listening to everyone’s
presentation, compare your game to those of your classmates. List the
advantages and disadvantages to your game. Make improvements to your
game based on your list of disadvantages.
418
Chapter 9 Probability and Statistics
ADVERTISEMENT
0 votes
Related Articles
Related forms


Related Categories
Parent category: Education