Project Planing Page 11
ADVERTISEMENT
 1
1 2
2 3
3 4
4 5
5 6
6 7
7 8
8 9
9 10
10 11
11 12
12 13
13 14
14 15
15 16
16 17
17 18
18 19
19 20
20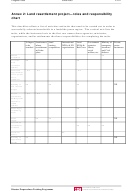 21
21 22
22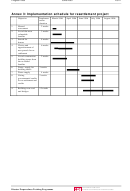 23
23 24
24 25
25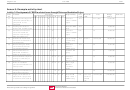 26
26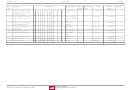 27
27Projplan1.doc
June 2000
11/27
3.3
Gantt (bar) charts
One of the most popular project planning techniques for scheduling, reporting, and control
of simple projects is the Gantt or bar chart. This technique graphically represents the
progress of a project versus the time frame within which it must be completed. Gantt
charts are excellent graphical representations for scheduling the execution of various
project activities. They can be used as simple and easily understood models for
communicating information to all levels or for project management and supervision. Gantt
charts allow project managers to plan all activities, estimate the time necessary to complete
each, estimate the time required to complete the overall project and monitor project
progress. To prepare a Gantt chart:
1. List each of the discrete project activities or tasks that needs to be completed
2. Establish the execution sequence of these activities
3. Estimate the duration of these activities (done in collaboration with those responsible
for completing the activities)
4. List all activities in chronological order and determine those that can be carried out
simultaneously and those that must be carried out sequentially.
5. Consider the resource requirements and allocations for each activity
Gantt charts can be prepared easily with graph paper, or by drawing lines on blank paper.
They are a common feature of project planning software, but any spreadsheet or
sophisticated word processing program can also be used to create these charts.
The following diagram is a sample Gantt chart.
April
Time frame (Months)
Start date
TASKS
0
1
2
3
4
5
6
7
8
9
10
A
01/04/00
B
28/04/00
C
03/05/00
D
16/06/00
E
01/07/00
International Federation
Disaster Preparedness Training Programme
of Red Cross and Red Crescent Societies
ADVERTISEMENT
0 votes
Related Articles
Related forms


")


Related Categories
Parent category: Business