Pictograms, Pie Charts, Stem And Leaf, Frequency Polygons Revison Worksheet Page 2
ADVERTISEMENT
 1
1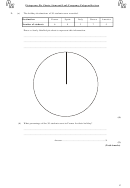 2
2 3
3 4
4 5
5 6
6Pictograms, Pie Charts, Stem and Leaf, Frequency Polygons Revison
2.
(a)
The holiday destinations of 30 students were recorded.
France
Spain
Italy
Greece
America
Destination
6
9
3
7
5
Number of students
Draw a clearly labelled pie chart to represent this information.
.....................................................................................................................................
.....................................................................................................................................
.....................................................................................................................................
(4)
(b) What percentage of the 30 students went to France for their holiday?
.....................................................................................................................................
.....................................................................................................................................
Answer ....................................................................%
(2)
(Total 6 marks)
2
ADVERTISEMENT
0 votes
Related Articles
Related forms


Related Categories
Parent category: Education