Pictograms, Pie Charts, Stem And Leaf, Frequency Polygons Revison Worksheet Page 5
ADVERTISEMENT
 1
1 2
2 3
3 4
4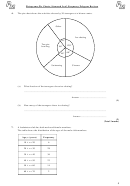 5
5 6
6Pictograms, Pie Charts, Stem and Leaf, Frequency Polygons Revison
4.
The pie chart shows the activities chosen by 30 teenagers at a leisure centre.
Other
Ice-skating
36º
Ten-pin
120º
bowling
96º
60º
48º
Cinema
Swimming
(a)
What fraction of the teenagers chose ice-skating?
......................................................................................................................................
Answer ...........................................
(1)
(b)
How many of the teenagers chose ice-skating?
......................................................................................................................................
Answer .........................................
(2)
(Total 3 marks)
7.
A badminton club has both male and female members.
The table shows the distribution of the ages of the male club members.
Age, x (years)
Frequency
10 x < 20
6
20 x < 30
28
30 x < 40
36
40 x < 50
23
50 x < 60
14
60 x < 70
2
5
ADVERTISEMENT
0 votes
Related Articles
Related forms


Related Categories
Parent category: Education