Pictograms, Pie Charts, Stem And Leaf, Frequency Polygons Revison Worksheet Page 3
ADVERTISEMENT
 1
1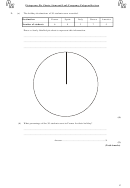 2
2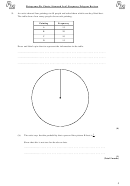 3
3 4
4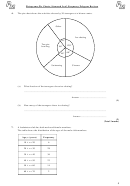 5
5 6
6Pictograms, Pie Charts, Stem and Leaf, Frequency Polygons Revison
3.
An artist showed four paintings to 60 people and asked them which one they liked best.
The table shows how many people chose each painting.
Painting
Frequency
A
15
B
20
C
10
D
15
Draw and label a pie chart to represent the information in the table.
................................…………………………………………………………………………
................................…………………………………………………………………………
................................…………………………………………………………………………
(4)
1
(b)
The artist says that the probability that a person likes picture B best is
.
4
Show that this is not true for the above data.
.....................…………………………………………………………………………
.....................…………………………………………………………………………
(1)
(Total 5 marks)
3
ADVERTISEMENT
0 votes
Related Articles
Related forms


Related Categories
Parent category: Education