Pictograms, Pie Charts, Stem And Leaf, Frequency Polygons Revison Worksheet Page 4
ADVERTISEMENT
 1
1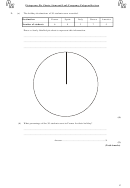 2
2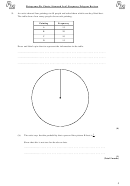 3
3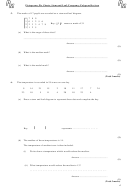 4
4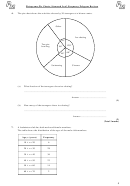 5
5 6
6Pictograms, Pie Charts, Stem and Leaf, Frequency Polygons Revison
5.
The marks of 17 pupils are recorded on a stem and leaf diagram.
0
7
8
9
1
0
1
2
5
6
Key: 3 1 means a mark of 31
2
2
3
3
4
7 8
3
1
2
5
(a)
What is the range of these data?
.....................................................................................................................................
Answer ....................................................
(1)
(b) What is the median mark?
Answer ....................................................
(1)
(c)
What is the modal mark?
Answer ....................................................
(1)
(Total 3 marks)
6.
The temperature is recorded in 19 towns on one day.
9
14
21
15
2
10
11
17
7
24
23
18
5
11
4
20
18
23
4
(a)
Draw a stem and leaf diagram to represent these data and complete the key.
|
|
represents .....................……………
Key
(3)
(b) The median of these temperatures is 14.
The temperature of another town is then included.
(i)
Write down a temperature which would reduce the median.
Answer ............................................
(1)
(ii) What temperature would reduce the median to 13?
………………………………………………………………………………..
Answer ............................................
(1)
(Total 5 marks)
4
ADVERTISEMENT
0 votes
Related Articles
Related forms


Related Categories
Parent category: Education