Pictograms, Pie Charts, Stem And Leaf, Frequency Polygons Revison Worksheet Page 6
ADVERTISEMENT
 1
1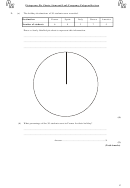 2
2 3
3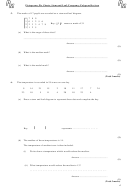 4
4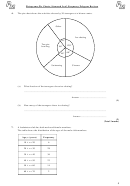 5
5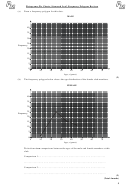 6
6Pictograms, Pie Charts, Stem and Leaf, Frequency Polygons Revison
(a)
Draw a frequency polygon for this data.
MALE
40
35
30
25
Frequency
20
15
10
5
0
0
10
20
30
40
50
60
70
Age, (years)
x
(2)
(b)
The frequency polygon below shows the age distribution of the female club members.
FEMALE
40
35
30
25
Frequency
20
15
10
5
0
0
10
20
30
40
50
60
70
Age, (years)
x
Write down two comparisons between the ages of the male and female members at this
club.
Comparison 1: ………………………………………………………………………
……………………………………………………………………………………….
Comparison 2: ………………………………………………………………………
……………………………………………………………………………………….
(2)
(Total 4 marks)
6
ADVERTISEMENT
0 votes
Related Articles
Related forms


Related Categories
Parent category: Education