Unit 1: Collection, Display, And Interpretation Of Data Worksheet - 6th Grade Page 17
ADVERTISEMENT
 1
1 2
2 3
3 4
4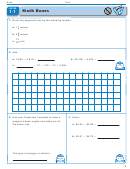 5
5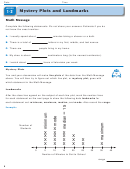 6
6 7
7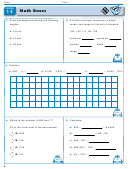 8
8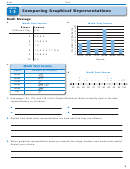 9
9 10
10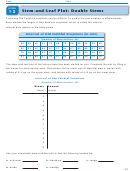 11
11 12
12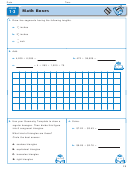 13
13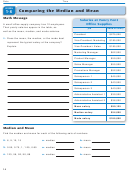 14
14 15
15 16
16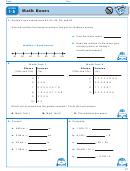 17
17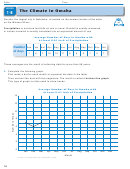 18
18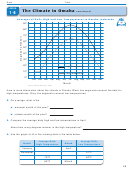 19
19 20
20 21
21 22
22 23
23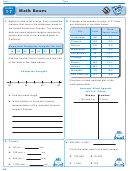 24
24 25
25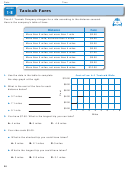 26
26 27
27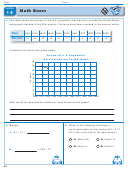 28
28 29
29 30
30 31
31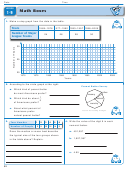 32
32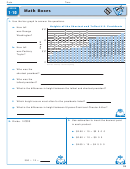 33
33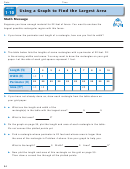 34
34 35
35 36
36 37
37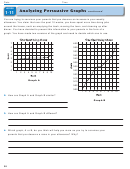 38
38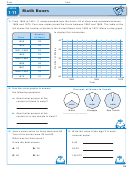 39
39 40
40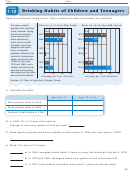 41
41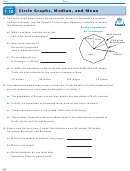 42
42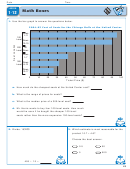 43
43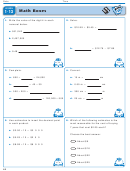 44
44Date
Time
LESSON
Math Boxes
1 5
Hadley’s quiz scores were 82, 54, 93, 84, and 92.
1.
Use the number line below to make a line plot for Hadley’s scores.
Find the mean score.
a.
Does the median or the mean give
b.
Hadley’s Quiz Scores
a better picture of Hadley’s
overall performance?
40
50
60
70
80
90
100
134–137
Math Test 2
2.
Math Test 1
Stems
Leaves
Stems
Leaves
(100s and 10s)
(1s)
(100s and 10s)
(1s)
6
1 2 2 4 5 6 9 9
5
7
6
3 4 8
7
2 2 3 6 8 9
7
0 0 5 5 5 6 7 8
8
1 1 1 3 6 7
8
1 4 4 4 4 7 7 8 8
9
0 2 2 4 5 5 6
9
2 3 5 9
10
0 0
Which set of scores has the greater median? Circle the best answer.
Math Test 1
Math Test 2
The medians are equal.
A.
B.
C.
134–136
Convert.
Complete.
3.
4.
480 cm
m
1,500 / 5
a.
a.
0.88 m
cm
8,100 /
9
b.
b.
39 cm
m
/ 90
50
c.
c.
1.08 m
cm
28,000 / 70
d.
d.
2,100 / 3
e.
210
21
17
ADVERTISEMENT
0 votes
Related Articles
Related forms


Related Categories
Parent category: Education