Unit 1: Collection, Display, And Interpretation Of Data Worksheet - 6th Grade Page 41
ADVERTISEMENT
 1
1 2
2 3
3 4
4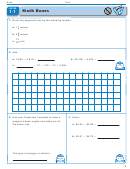 5
5 6
6 7
7 8
8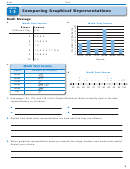 9
9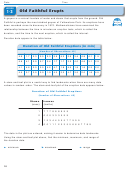 10
10 11
11 12
12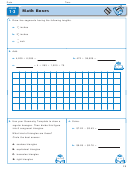 13
13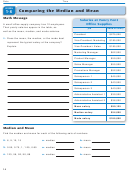 14
14 15
15 16
16 17
17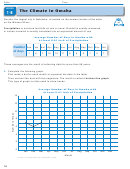 18
18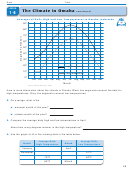 19
19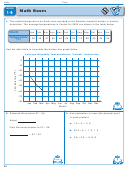 20
20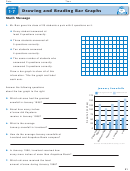 21
21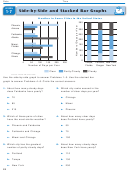 22
22 23
23 24
24 25
25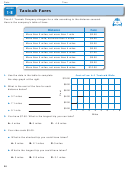 26
26 27
27 28
28 29
29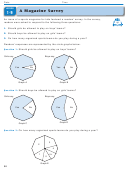 30
30 31
31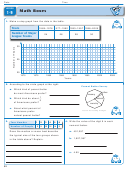 32
32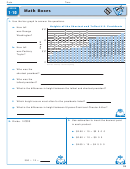 33
33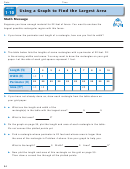 34
34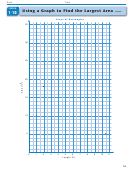 35
35 36
36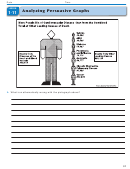 37
37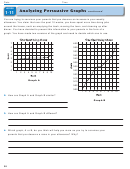 38
38 39
39 40
40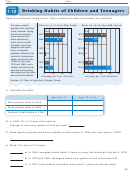 41
41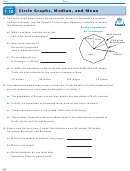 42
42 43
43 44
44Date
Time
LESSON
Drinking Habits of Children and Teenagers
1 12
Read the newspaper article below. Then complete the table and answer the questions.
What 6- to 11-Year-Olds Drink
What 12- to 19-Year-Olds Drink
For years, experts
praised milk’s nutritional
Milk
Milk
value. However, during
the last two decades,
1978
46.4
1978
49.6
have
many experts
been questioning
1994
38.7
1994
32.9
milk’s role in the diet
Apple and Grape Juice
Apple and Grape Juice
of children who have
-
allergies, sinus prob
1978
1.4
1978
0.8
lems, or intestinal
problems. Based on the
1994
3.5
1994
2.7
results of a comparison
Soft Drinks
Soft Drinks
study conducted by the
USDA (for the years
1978
10.6
1978
20.6
1978 and 1994), many
children are consuming
1994
20.0
1994
62.5
less milk and choosing
beverages such as juices
0
20
40
60
0
20
40
60
80
and soft drinks instead.
Average per Year (Gallons)
Average per Year (Gallons)
Sources: U.S. Dept. of Agriculture; Chicago Tribune
Complete the table.
1.
Ages 6 to 11
Ages 12 to 19
Most popular drink in 1978
Most popular drink in 1994
Gallons of soft drinks in 1994
In 1994, 12- to 19-year-olds drank an
2.
average of how many gallons of milk per year?
Were apple and grape juice more popular or less popular in 1994 than they were in 1978?
3.
Write T for true or F for false.
4.
In 1994, teenagers drank about 3 times as many soft drinks as they did in 1978.
a.
In 1978 and 1994, teenagers drank more gallons of soft drinks than milk.
b.
In 1994, both children and teens drank about 1 gallon of milk per week.
c.
41
ADVERTISEMENT
0 votes
Related Articles
Related forms


Related Categories
Parent category: Education