Unit 1: Collection, Display, And Interpretation Of Data Worksheet - 6th Grade Page 42
ADVERTISEMENT
 1
1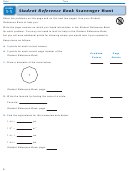 2
2 3
3 4
4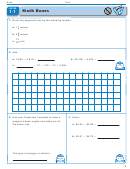 5
5 6
6 7
7 8
8 9
9 10
10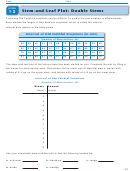 11
11 12
12 13
13 14
14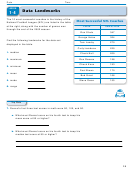 15
15 16
16 17
17 18
18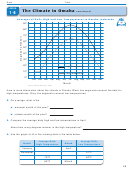 19
19 20
20 21
21 22
22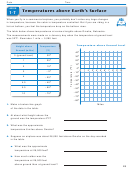 23
23 24
24 25
25 26
26 27
27 28
28 29
29 30
30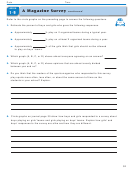 31
31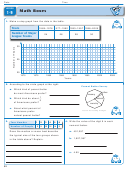 32
32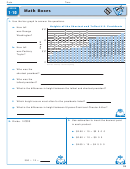 33
33 34
34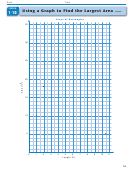 35
35 36
36 37
37 38
38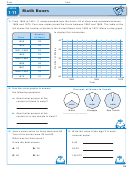 39
39 40
40 41
41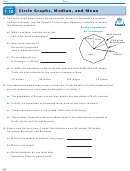 42
42 43
43 44
44Date
Time
LESSON
Circle Graphs, Median, and Mean
1 12
The circle graph below shows the approximate percent of the world’s population
1.
136–137,
on each continent. Use the Percent Circle on your Geometry Template to answer
145
the following questions.
World Population
by Continent
Which continent contains more than
a.
North America
half of the world’s population?
Europe
Africa
Central and
South America
About what percent of
b.
the world’s population
lives in North America?
Asia
Oceania
Do more people live
c.
in Europe or in Africa?
In 2004, the population of the world was approximately 6,200,000,000 people.
d.
Circle the best estimate for the number of people in Asia.
3.5 million
35 million
350 million
3.5 billion
The statements below may or may not be true. Circle the letter of each statement that
2.
you can determine is true based on the graph in Problem 1.
The population of Europe is more than double the population of North America.
a.
In Asia, the population is increasing faster than on any other continent.
b.
There are more people in the United States than in Germany.
c.
The number of people in Africa is about equal to the total number of people in
d.
North, South, and Central America.
Elaine tried the long jump 5 times. Her distances were 56 inches, 62 inches,
3.
34 inches, 58 inches, and 62 inches.
What is the median of Elaine’s long jumps?
a.
What is the mean?
b.
Which landmark do you think best
c.
represents Elaine’s typical jump?
42
ADVERTISEMENT
0 votes
Related Articles
Related forms


Related Categories
Parent category: Education