Unit 1: Collection, Display, And Interpretation Of Data Worksheet - 6th Grade Page 31
ADVERTISEMENT
 1
1 2
2 3
3 4
4 5
5 6
6 7
7 8
8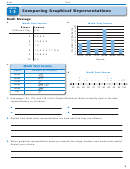 9
9 10
10 11
11 12
12 13
13 14
14 15
15 16
16 17
17 18
18 19
19 20
20 21
21 22
22 23
23 24
24 25
25 26
26 27
27 28
28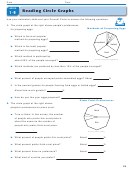 29
29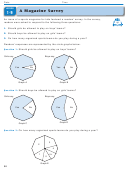 30
30 31
31 32
32 33
33 34
34 35
35 36
36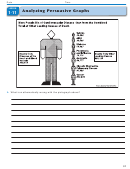 37
37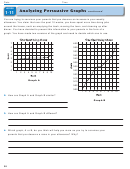 38
38 39
39 40
40 41
41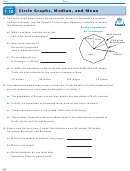 42
42 43
43 44
44Date
Time
LESSON
A Magazine Survey
1 9
continued
Refer to the circle graphs on the preceding page to answer the following questions.
145
Estimate the percent of boys and girls who gave the following responses.
1.
Approximately
% play on 2 organized teams during a typical year.
a.
Approximately
% play on at least 2 organized teams during a year.
b.
Approximately
% of the girls think that girls should not be allowed
c.
to play on boys’ teams.
Which graph (A, B, C, or D) shows almost everyone agreeing on an answer?
2.
Which graph (A, B, C, or D) shows opinions that are almost evenly divided
3.
between yes and no?
Do you think that the readers of the sports magazine who responded to this survey
4.
play sports more often, less often, or about the same amount of time as the
students in your school? Explain.
Circle graphs on journal page 30 show how boys and girls responded to a survey about
5.
boys playing on girls’ teams and girls playing on boys’ teams. Explain how girls’ and
boys’ responses to the survey are alike and how they are different.
31
ADVERTISEMENT
0 votes
Related Articles
Related forms


Related Categories
Parent category: Education