Unit 1: Collection, Display, And Interpretation Of Data Worksheet - 6th Grade Page 32
ADVERTISEMENT
 1
1 2
2 3
3 4
4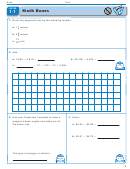 5
5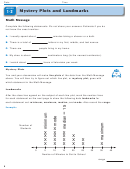 6
6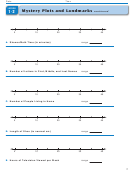 7
7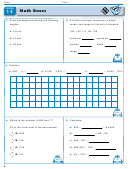 8
8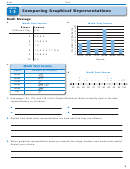 9
9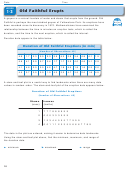 10
10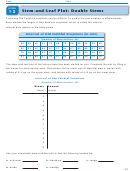 11
11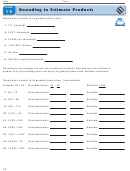 12
12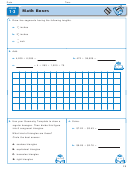 13
13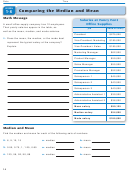 14
14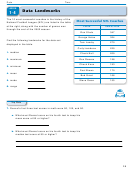 15
15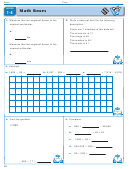 16
16 17
17 18
18 19
19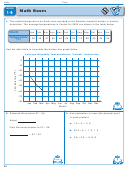 20
20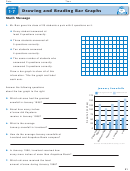 21
21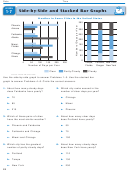 22
22 23
23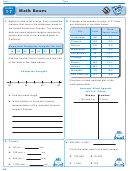 24
24 25
25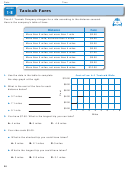 26
26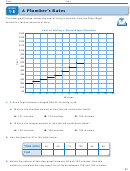 27
27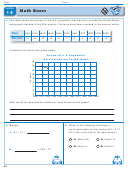 28
28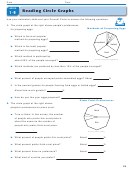 29
29 30
30 31
31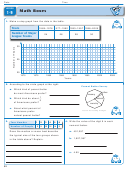 32
32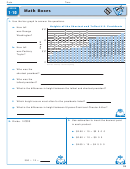 33
33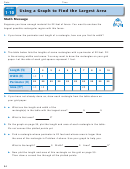 34
34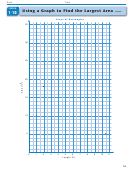 35
35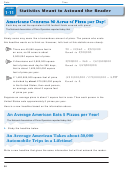 36
36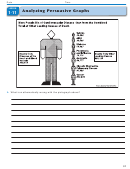 37
37 38
38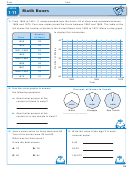 39
39 40
40 41
41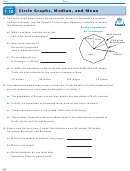 42
42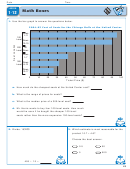 43
43 44
44Date
Time
LESSON
Math Boxes
1 9
Make a step graph from the data in the table.
1.
141
Years
1969–1976 1977–1992 1993–1997 1998–2005
Number of Major
24
26
28
30
League Teams
30
25
20
1970
1975
1980
1985
1990
1995
2000
2005
Years
According to the circle graph at the right:
2.
Peanut Butter Survey
Which kind of peanut butter
a.
other
do most Americans prefer?
creamy
1
Which kind do about
natural
b.
3
of Americans prefer?
crunchy
About what percent of
c.
Source: Astounding Averages
145
Americans prefer
natural peanut butter?
Write the value of the digit 9 in each
3.
4.
Tour Number
1
2
3 4
5
6
numeral below.
Number of People
10 9 40 12 14 5
Does the median or mean best describe
401,297
a.
the typical size of the tour groups shown
1,927,387
b.
in the table above? Explain.
4.95
c.
4 28
32
ADVERTISEMENT
0 votes
Related Articles
Related forms


Related Categories
Parent category: Education