Unit 1: Collection, Display, And Interpretation Of Data Worksheet - 6th Grade Page 24
ADVERTISEMENT
 1
1 2
2 3
3 4
4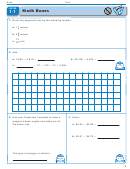 5
5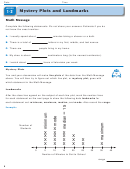 6
6 7
7 8
8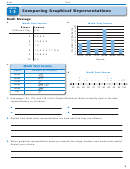 9
9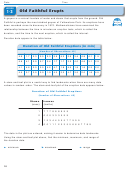 10
10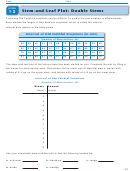 11
11 12
12 13
13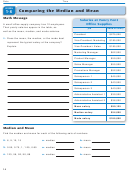 14
14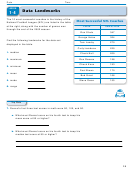 15
15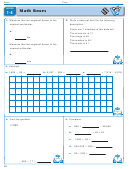 16
16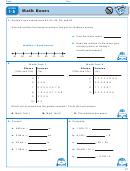 17
17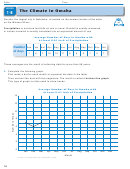 18
18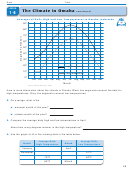 19
19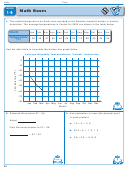 20
20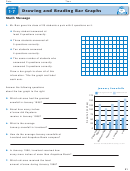 21
21 22
22 23
23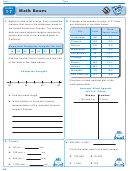 24
24 25
25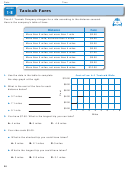 26
26 27
27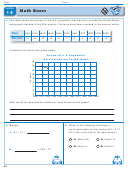 28
28 29
29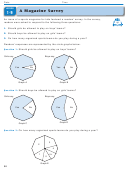 30
30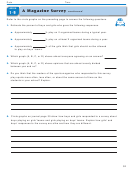 31
31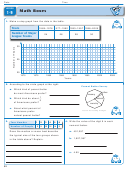 32
32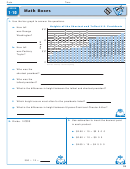 33
33 34
34 35
35 36
36 37
37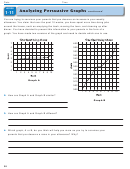 38
38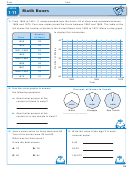 39
39 40
40 41
41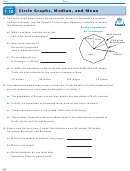 42
42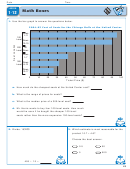 43
43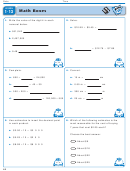 44
44Date
Time
LESSON
Math Boxes
1 7
Bigfoot is said to be a large, hairy, humanlike
Average wind speeds for major U.S. cities
1.
2.
creature that lives in the wilderness areas of
are displayed in the table below.
the United States and Canada. The following
Wind
City
State
data are some footprint lengths reported by
Speed (mph)
people who claim to have seen Bigfoot in
Anchorage
AK
7.1
California.
Phoenix
AZ
6.2
Denver
CO
8.6
Reported Footprint Lengths (in cm)
Washington
DC
9.4
36
46
36
38
33
40
37
56
Des Moines
IA
10.7
Chicago
IL
10.3
Use the number line to construct a line plot
Boston
MA
12.4
of the data in the table above.
Helena
MT
7.7
Memphis
TN
8.8
Footprint Lengths
Salt Lake City
UT
8.8
Construct a stem-and-leaf plot of the
wind-speed data.
30
40
50
60
Average Wind Speeds
for U.S. Cities
Stems
Leaves
Find the mean length.
a.
(10s and 1s)
(10ths)
Is the median or the mean a better
b.
representation of the recorded footprint
lengths? Explain.
135
Convert.
3.
600,000 / 5,000
4.
18 cm
mm
a.
Circle the letter next to the best answer.
120 mm
cm
b.
120,000
12,000
A
B
254 cm
mm
c.
210
21
1,200
120
1,020 mm
cm
C
D
d.
24
ADVERTISEMENT
0 votes
Related Articles
Related forms


Related Categories
Parent category: Education